Replenishment methods and calculations
Related information
You can use three different replenishment methods to identify when to reorder inventory items and how much to reorder from each potential supplier. Use this topic to learn how each replenishment method works and how to set up your items.
Replenishment methods
Sage Intacct supports three replenishment methods: Demand forecast by single value, Demand forecast by fluctuating values, and Reorder point.
The two demand forecast methods are designed to keep enough inventory on hand to meet what you expect to sell. So, the forecasted demand of an item during supplier lead time is a key piece of identifying when items need to be replenished. What differs between the two demand forecast methods is how the forecasted demand during supplier lead time is determined:
- Demand forecast by single value: For each supplier, you enter a single value in the item that represents the demand during the supplier's lead time. This method is useful when demand for items is stable during the year.
- Demand forecast by fluctuating values: You define a fluctuating forecast for the item and enter the expected quantities needed on each given date regardless of supplier. For each supplier, the sum of the forecast quantities in the fluctuating forecast includes only those items with effective dates between the As of date and the end of the supplier's lead time. This sum represents the demand during the vendor's lead time. This is useful when demand for items fluctuates greatly during the year, such as for highly seasonal items.
The reorder point method is designed to keep inventory from falling below minimum stocking levels:
- Reorder point: You enter a reorder point and a specific quantity to reorder in the item. The values you enter are used to determine when to replenish the item.
Reorder point is the easiest replenishment method to set up, followed by Demand forecast by single value and then Demand forecast by fluctuating values. With a reorder point, you enter the reorder point and the quantity to reorder. With the two demand forecast replenishment methods, you need to do more analysis to determine the demand forecast per supplier or the demand forecast per given time period. Both methods require entering and maintaining more information. And, if you do not sell as much as you forecast, you end up with more inventory in your warehouses than anticipated.
Replenishment calculation overview
For each replenishment method, a mathematical calculation determines if an item is triggered for reordering and how much to reorder. The calculations for the replenishment methods suggest the most economical quantity to purchase, a quantity that minimizes both the total holding costs and total ordering costs. This quantity is displayed in the Quantity to purchase field in the supplier's unit of measure (UOM) in the Replenish Inventory page, and it can be overridden.
The calculations for the replenishment methods start with the As of date specified in the Replenish Inventory page. The As of date determines:
- The date Intacct starts to assess which items need reordering
- The period of time used to determine the demand forecast during the supplier lead time (As of date + Lead time days) for both demand forecast methods
- The date for calculating the current net inventory (On Hand + On Order - On Hold)
- The period of time used to calculate the net activity for future-dated Purchasing, Order Entry, and Inventory transactions (As of date + Lead time days) for both demand forecast methods
The replenishment method and the values in the replenishment fields in the item record then drive the rest of the calculation. The Economic order quantity field has a heavy influence on what Sage Intacct suggests as the quantity to purchase.
The following fields display at the item level on the Supplier history tab and at the item-warehouse level on the General tab for each listed warehouse, unless otherwise noted:
| Field | Demand forecast by | Reorder point | |
|---|---|---|---|
| Single value | Fluctuating values | ||
| Units of measure default1 (Supplier history tab only) | Checkmark (true) | Checkmark (true) | Checkmark (true) |
| Safety stock | Checkmark (true) | Checkmark (true) | Checkmark (true) |
| Maximum order quantity | Checkmark (true) | Checkmark (true) | Checkmark (true) |
| Reorder point | n/a | n/a | Checkmark (true) |
| Quantity to reorder | n/a | n/a | Checkmark (true) |
| The following fields are for each supplier entered in the Supplier entries table: | |||
| Supplier ID | Checkmark (true) | Checkmark (true) | Checkmark (true) |
| Lead time (days)* | Checkmark (true) | Checkmark (true) | n/a |
| Demand forecast during lead time | Checkmark (true) | n/a | n/a |
| Economic order quantity | Checkmark (true) | Checkmark (true) | Checkmark (true) |
| Supplier minimum order quantity | Checkmark (true) | Checkmark (true) | Checkmark (true) |
| Units of measure2 (unit supplier sells in) | Checkmark (true) | Checkmark (true) | Checkmark (true) |
|
Notes:
|
|||
For each replenishment method, when an item needs reordering, Intacct first calculates the quantity to purchase (Need to purchase) in the base unit of the item's unit of measure (UOM) group. Then, Intacct adjusts the Need to purchase to arrive at the Quantity to purchase. This value is a multiple of the economic order quantity and displays in the unit of measure used by the supplier.
Replenishment calculation for the demand forecast methods
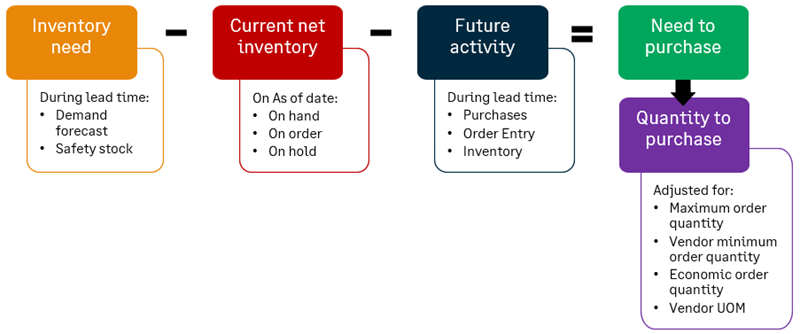
The calculation to determine when an item with a demand forecast method by a single value or by fluctuating values, needs reordering, is the same. In a nutshell, for each warehouse, Intacct suggests the quantity to purchase from each potential supplier by:
- Determining the demand of the item during the supplier's lead time
- Subtracting the current net inventory and the future activity during the supplier's lead time to arrive at what's needed
- Adjusting what's needed into a recommended quantity to purchase. The recommendation is based on additional factors, which include: the maximum order quantity, the supplier minimum order quantity, the economic order quantity, and the UOM in which the supplier sells
Let's walk through the calculation:
- Inventory need. The inventory needed is the demand forecast for the item for the warehouse during the supplier's lead time (As of date plus lead time days) plus the safety stock. The demand forecast is determined based on the replenishment method:
- For demand forecast by single value: The Demand forecast during lead time column in the Supplier entries table for the item or item-warehouse combination, contains the demand forecast values for the supplier.
- For demand forecast by fluctuating values: The sum of the forecast quantities in the fluctuating forecast for the item with dates during the supplier's lead time (As of date plus lead time days) is the demand forecast. Learn How a fluctuating demand forecast works.
What's the unit of measure for the calculation?The calculation is in the base unit of the item's UOM group. The Units of measure default in the Supplier history tab of the item determines the UOM for the Safety stock field. The Units of measure for each supplier in the Supplier entries table for the item or item-warehouse combination determines the UOM for the Demand forecast during lead time field. If these UOMs are not the same as the base unit of the item's UOM group, Sage Intacct converts the values in these fields into the base unit of the item's UOM group.
Example of conversionAssume that the base unit of the item is Each, the Units of measure default is Each, and the replenishment method is Demand forecast by single value.
- If the Safety stock is 25, the value does not need to be converted because its UOM matches the base unit of the item (Each).
- If the Demand forecast is 10 for Supplier A and the supplier's UOM is Dozen, Intacct converts 10 to 120 (conversion is: 12 units in a dozen x 10 = 120).
The inventory need displays as 145 (25 + 120) in the UOM of Each.
You might need more or less inventory depending on the existing inventory of the item and the inventory activity from future-dated Purchasing, Order Entry, and Inventory Control transactions during the supplier lead time.
- Current net inventory. Intacct then calculates the net inventory of the item (On Hand + On Order - On Hold) on the As of date and subtracts that value from the Inventory Need.What's the unit of measure for the calculation?
The calculation is in the base unit of the item's UOM group.
The transaction definitions for your purchase orders and sales orders need to be configured to affect the On Order and On Hold quantities. - Future transaction activity. Intacct then calculates the net inventory activity for future-dated Purchasing, Order Entry, and Inventory Control transactions during supplier lead time (As of date plus lead time days), and subtracts that value to arrive at the Need to purchase. If the item is a component of any standard kits, the future activity of the standard kits is also included. What's the calculation and the unit of measure for the calculation?
The calculation is in the base unit of the item's UOM group.
Purchasing transactions (On Hand + On Order - On Hold) + Order Entry transactions (On Hand + On Order - On Hold) + Inventory Control transactions (On Hand + On Order - On Hold)
- Need to purchase. Intacct adjusts the Need to Purchase quantity to arrive at the suggested Quantity to purchase, based on the maximum order quantity, the supplier minimum order quantity, the economic order quantity, and the UOM in which the supplier sells. For each replenishment method, Intacct uses the same calculations to adjust the Need to purchase into the Quantity to purchase. See how the Need to purchase is adjusted into Quantity to purchase.
Replenishment calculation for the reorder point method
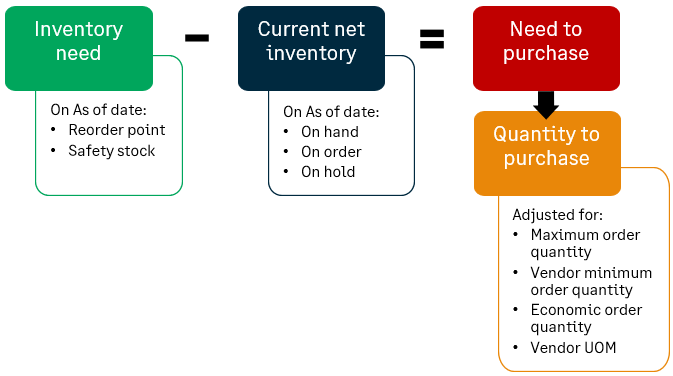
For the reorder point replenishment method, the reorder point and the safety stock trigger when an item needs to be replenished for each warehouse. If the current inventory for an item is less than the inventory needed to maintain a minimum stocking level, the item needs to be reordered:
Let's walk through the calculation:
- Inventory need. The inventory needed on the As of date is the reorder point plus the safety stock. The inventory needed represents the minimum stocking level desired for the item. What's the unit of measure for the calculation?
The calculation is in the base unit of the item's UOM group. The Units of measure default in the Supplier history tab of an item determines the units of measure (UOM) for the Reorder point and Safety stock fields. If this UOM is not the same as the base unit of item's UOM group, the quantity of the reorder point and the safety stock are converted into the base unit of the item.
Example of conversionAssume that the base unit of the item is Each and the Units of measure default is Dozen. If the reorder point is 5, Intacct converts the quantity to 60 (conversion is: 12 units in a dozen x 5 = 60). If the safety stock is 2, Intacct converts the quantity to 24, using the same conversion logic. Thus, the inventory needed is shown as 84 (60 + 24) in the UOM of Each.
- Current net inventory. Intacct then calculates the net inventory of the item on the As of date (On Hand + On Order - On Hold) and subtracts that value from Inventory need to arrive at the Need to purchase.What's the unit of measure for the calculation?
The calculation is in the base unit of the item's UOM group.
The transaction definitions for your purchase orders and sales orders need to be configured to affect the On Order and On Hold quantities. - Need to purchase. If the calculated need to purchase is greater than 0, the item is triggered for reorder because the quantity of the item has fallen below the minimum stocking level. Sage Intacct then uses the greater of these two values as the Need to purchase:
- The Quantity to reorder, which is defined in the item
- The calculated Need to purchase
As with the other replenishment methods, the Need to purchase is adjusted to arrive at a suggested Quantity to purchase, based on quantity limits and the vendor's unit of measure.
How the Need to purchase is adjusted into the Quantity to purchase
Sage Intacct adjusts the Need to purchase to arrive at the Quantity to purchase, based on the quantity limits specified. These include the maximum order quantity, the supplier minimum order quantity, the economic order quantity, and the UOM in which the supplier sells.
- If the Need to purchase > Maximum order quantity (in the item's base unit), the Maximum order quantity (in the item's base unit) is used as the Need to purchase.
- If the Need to purchase < Supplier minimum order quantity (in the item's base unit), the Supplier minimum order quantity (in the item's base unit) is used as the Need to purchase.
- If the Need to purchase is not a multiple of the Economic order quantity (EOQ), Intacct converts it into a multiple of the EOQ:
- Supplier UOM is the same as the item's base unit. The Need to purchase is divided by the EOQ and the result is rounded up to the next whole number. The EOQ is multiplied by the round up number.
- Supplier UOM is different than the item's base unit. The Need to purchase is divided by the EOQ (as expressed in the item's base unit) and the result is rounded up to the next whole number. The whole number is then multiplied by the EOQ (expressed in the item's base unit) and then divided by the number of base units in the supplier's UOM.
The following table provides some examples of how the Need to purchase is adjusted to derive the Quantity to purchase. Here are the assumptions:
- The item's base unit is Each (from Item header).
- The item's UOM default for replenishment is Each (from the header in the Supplier history tab for the item) and applies to the unit of measure for Maximum order quantity. If the UOM default is different from the item's base unit, convert the Maximum order quantity into the base unit of the item.
| Example | Need to purchase | Max order qty | Supplier min order qty | Supplier UOM | EOQ | EOQ for calculation* | Quantity to purchase |
|---|---|---|---|---|---|---|---|
| 1 | 100 | 200 | 1 | Each | 12 | 12 | 108 |
| 2 | 100 | 80 | 1 | Each | 12 | 12 | 84 |
| 3 | 100 | 200 | 1 | Dozen | 2 | 24 | 10 |
| 4 | 100 | 80 | 200 | Each | 1 | 1 | 200 |
| *Note: EOQ for calculation is the EOQ converted from the supplier's UOM into the item's base unit. | |||||||
- Need to purchase (100) < Maximum order quantity (200). Need to purchase remains 100.
- Need to purchase (100) > Supplier minimum order quantity (1). Need to purchase remains 100.
- The supplier UOM is the same as item's base unit. So, the EOQ for the calculation is the same as the EOQ.
- Need to purchase (100) / EOQ for calculation (12)= 8.3.
- 8.3 rounds up to 9.
- EOQ for calculation (12) x Round up (9) = 108.
- Need to purchase (100) > Maximum order quantity (80). Need to purchase is changed to 80.
- Need to purchase (80) > Supplier minimum order quantity (1). Need to purchase remains 80.
- The supplier UOM is the same as item's base unit. So, the EOQ for the calculation is the same as the EOQ.
- Need to purchase (80) / EOQ for calculation (12)= 6.7.
- 6.7 rounds up to 7.
- EOQ for calculation (12) x Round up (7) = 84.
- Need to purchase (100) < Maximum order quantity (200). Need to purchase remains 100.
- Need to purchase (100) > Supplier minimum order quantity (1). Need to purchase remains 100.
- The supplier UOM is not the same as the item's base unit. So, the EOQ for the calculation is converted into the item's base unit. The supplier UOM of a dozen is 12 in the item's base unit of Each. The EOQ for the calculation is 24 (EOQ of 2 x 12 = 24).
- Need to purchase (100) / EOQ for calculation (24) = 4.2
- 4.2 rounds up to 5.
- The quantity to purchase is 5 orders of 24 units: 120 units (5 x 24).
- The supplier sells in dozens and a dozen is 12 in the item's base unit of each. So, 120 is divided by 12 to arrive at 10. The quantity to purchase is 10 dozen.
- Need to purchase (100) > Maximum order quantity (80). Need to purchase is changed to 80.
- Need to purchase (80) < Supplier minimum order quantity (200). Need to purchase is changed to 200.
- The supplier UOM is the same as item's base unit. So, the EOQ for the calculation is the same as the EOQ.
- Need to purchase (200) / EOQ for calculation (1) = 200.
- Round up is 200.
- EOQ (1) x Round up (200) = 200.
Stockable kits
Stockable kits can be enabled for replenishment. The component items of the kits are replenished based on the replenishment requirements specified for the parent stockable kits. For example, Stockable Kit A needs 2 units of a component item, and 2 units of Stockable Kit A are requested. The quantity of the component item needed for Stockable Kit A is 4 (2 x 2 = 4).
If the replenishment method is Demand forecast by fluctuating values, Intacct determines the lead time that's needed to calculate the demand forecast and the future transaction activity (Purchasing, Order Entry, and Inventory Control transactions). The lead time is determined by assessing all the component items in all the kits and all their suppliers and choosing the longest lead time that's found.
Units of measure
Sage Intacct automatically handles any units of measure conversions in the replenishment calculations. During the calculations, all the numbers are converted into the base unit of the item. The Quantity to purchase is reflected in the supplier's unit of measure. This quantity is scaled to order at least the minimum quantity the supplier wants to sell, and in multiples of the supplier's economic order quantity.
These fields in an item record define the UOMs and conversions that are needed in the calculations:
- Base unit (in the item header in the General tab) identifies the base unit of the item's UOM group. For example, if Count was selected as the unit of measure for the item, the base unit is Each.
- Units of measure default (in the Replenishment section in the Supplier history tab) is the unit of measure for the following fields:
- Safety stock
- Maximum order quantity
- Reorder point
- Quantity to reorder
- The quantities in the fluctuating demand forecast for the item
- Units of measure (in the Supplier entries table in the Supplier history tab or for a warehouse in the General tab) is the unit of measure for the following fields in the table:
- Demand forecast during lead time
- Economic order quantity
- Supplier minimum order quantity
Replenishment calculation examples
To keep the examples of walking through the replenishment calculations simple, we'll look at reordering just one item, which is not a component in any stockable kit. The item is purchased from only one supplier and for only one warehouse. For each example, we'll show the setup for the item in the Supplier history tab, where you:
- Select the replenishment method and enter values for the other replenishment fields in the header
- Enter values for the supplier in the Supplier entries table
Then we'll show how those values are factored into the calculation for the suggested Quantity to purchase.
Example 1 - Demand forecast by single value
Setup
In this example, the demand forecast is determined by the Demand forecast during lead time field for the supplier. The following table shows all the values entered in the fields in the Supplier history tab for the item:
| Field | Value entered |
|---|---|
| Units of measure default | Each |
| Safety stock | 4 |
| Replenishment method | Forecast method by single value |
| Maximum order quantity | 40 |
| Supplier ID | Lead time (days) | Demand forecast during lead time | Economic order qty | Supplier min order qty | Units of measure |
|---|---|---|---|---|---|
| ACME Corp | 5 | 6 | 4 | 8 | Each |
Results
The Replenish Inventory page displays results based on these assumptions:
- The As of date is June 1.
- The current net inventory on the As of date is 5 (On Hand + On Order - On Hold).
- Future purchasing, sales, and inventory transactions within the 5-day lead time is -10. There's a future-dated sales transaction for 10 units on June 3.
| Field | Value displayed | Explanation |
|---|---|---|
| Supplier name | ACME Corp | |
| Lead time (days) | 5 | |
| Inventory need | 10 |
Demand forecast during lead time (6) + Safety stock (4) = 10 |
| Current net inventory | 5 |
On Hand + On Order - On Hold |
| Future activity | -10 |
There's a future-dated sales transaction for 10 units on June 3. |
| Need to purchase | 15 |
Inventory need (10) - Current net inventory (5) - Future activity (-10) = 15 |
| Round up | 4 |
Need to purchase (15) / Economic order quantity (4) = 3.75 Keeps the suggested quantity to purchase in multiples of the economic order quantity. |
| Quantity to purchase | 16 |
Round up (4) x the Economic order quantity (4) = 16 |
Example 2 - Demand forecast by fluctuating values
Setup
In this example, a fluctuating demand forecast determines the demand for the item. First, the following table shows all the values entered in the fields in the Supplier history tab for the item:
| Field | Value entered |
|---|---|
| Units of measure default | Each |
| Safety stock | 4 |
| Replenishment method | Demand forecast by fluctuating values |
| Maximum order quantity | 40 |
| Supplier ID | Lead time (days) | Economic order qty | Supplier min order qty | Units of measure |
|---|---|---|---|---|
| ACME Corp | 5 | 4 | 8 | Each |
Next, the following table summarizes the entries in the fluctuating demand forecast. In this example, daily forecasts were entered for the item.
| Effective date | Forecast quantity | Warehouse |
|---|---|---|
| June 7 | 2 | |
| June 6 | 0 | |
| June 5 | 2 | |
| June 4 | 4 | |
| June 3 | 6 | |
| June 2 | 6 | |
| June 1 | 10 | |
| May 31 | 20 | |
| May 30 | 20 |
Results
The Replenish Inventory page displays results based on these assumptions:
- The As of date is June 1.
- The current net inventory on the As of date is 5 (On Hand + On Order - On Hold).
- Future purchasing, sales, and inventory transactions within the 5-day lead time is -10. There's a future-dated sales transaction for 10 units on June 3.
| Field | Value displayed | Explanation |
|---|---|---|
| Supplier name | ACME Corp | |
| Lead time (days) | 5 | |
| Inventory need | 32 |
Demand forecast (28) + Safety stock (4) = 32 The As of date is June 1 and the lead time is 5 days. So, the demand forecast period is from June 1 to June 5. Intacct calculates the demand forecast by adding up the forecast quantities in the entries for Jun-01, Jun-02, Jun-03, Jun-04, and Jun-05 (10 + 6 + 6 + 4 + 2 = 28). The table in the Setup section for this example shows a summary of the entries in the fluctuating forecast. |
| Current net inventory | 5 |
On Hand + On Order - On Hold |
| Future activity | -10 |
There's a future-dated sales transaction for 10 units on June 3. |
| Need to purchase | 37 |
Inventory need (32) - Current net inventory (5) - Future activity (-10) = 37 |
| Round up | 10 |
Need to purchase (37) / Economic order quantity (4) = 9.25 Keeps the suggested quantity to purchase in multiples of the economic order quantity. |
| Quantity to purchase | 40 |
Round up (10) x the Economic order quantity (4) = 40 |
Example 3 - Reorder point
Setup
In this example, the item is set up for replenishment when the stocking level reaches 11 (Reorder point + Safety stock). The following table shows all the values entered in the fields in the Supplier history tab for the item:
| Field | Value entered |
|---|---|
| Units of measure default | Each |
| Safety stock | 4 |
| Replenishment method | Reorder point |
| Reorder point | 7 |
| Quantity to reorder | 20 |
| Maximum order quantity | 40 |
| Supplier ID | Lead time (days) | Economic order qty | Supplier min order qty | Units of measure |
|---|---|---|---|---|
| ACME Corp | 5 | 4 | 8 | Each |
Results
The Replenish Inventory page displays these results, assuming the current net inventory of the item on the As of date is 5. A reorder is recommended because its current quantity of 5 is less than the minimum stocking level of 11.
| Field | Value displayed | Explanation |
|---|---|---|
| Supplier name | ACME Corp | |
| Lead time (days) | 5 | |
| Inventory need | 11 |
Reorder point (7) + Safety stock (4) = 11 |
| Current net inventory | 5 |
On Hand + On Order - On Hold |
| Future activity | 0 |
Future activity is not applicable for the reorder point replenishment method. |
| Need to purchase | 20 |
Inventory need (11) - Current net inventory (5) = 6 Reorder point (20) is greater than the calculated need to purchase (6) and becomes the need to purchase. |
| Round up | 5 |
Need to purchase (20) / Economic order quantity (4) = 5 Keeps the suggested quantity to purchase in multiples of the economic order quantity. |
| Quantity to purchase | 20 |
Round up (5) x Economic order quantity (4) = 20 |