Filter by dimension in rows—Financial report example
Related information
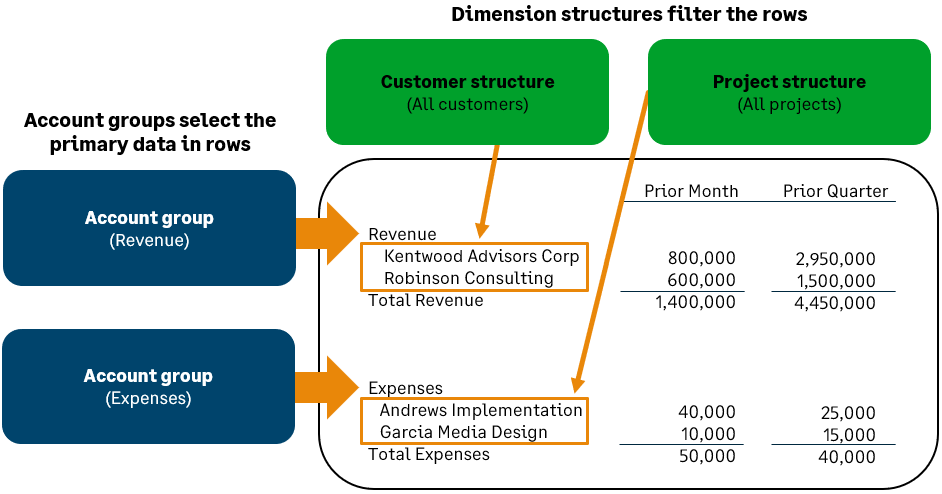
Use the Financial Report Writer to create a report similar to the one shown. In this example, report rows are built from account groups, such as "Revenue" and "Expenses." Each account group is then filtered by dimension structure to feature a different type of analysis. In this case, we’re showing revenue by customer and expenses by project.
This basic report structure can be used for any type of analysis. For example, filtering for members of different dimensions (such as items or projects) or creating more complex comparisons (such as by product line or customer type).
To create a new financial report:
-
Go to Reports > All > Core and select Add (circle) next to Financial reports.
Create this report
There are 4 basic steps for creating this type of report:
- Select your basic report structure on the Report Info tab.
For this type of report, choose Accounts on rows in the Report structure section. Then, select the option to Filter by dimension structure.
- Add account groups to your report rows.
Your account groups organize your accounts into hierarchies, allowing you to reflect how you report on assets, expenses, liabilities, and more. In this example, we're adding a Revenue account group and an Expenses account group.
-
Filter the account groups by dimension structure and set the detail level.
Here is where you add your custom analysis. You can create any number of re-usable dimension structures that correspond to how you want to slice and dice your data.
In this example, we're using dimension structures to filter revenue by customers and expenses by project. This technique can be used to create any type of analysis. Learn more about variations of this report.
- Add columns for different reporting periods.
1. Select your basic report structure
When you create a new financial report, the Report Info tab of the Financial Report Writer asks you to select a basic report structure. Based on your selection, the remaining tabs update to help you create that type of report.
To select your report structure:
- Create a new financial report.
- On the Report Info tab, name your report.
- In the Report structure section of the Report Info tab, select the option for Accounts on report rows.
- Select the option to Filter by dimension structure.
2. Add account groups to your report rows
In this example, separate account groups are added for Revenue and Expenses. In each case, the account group is collapsed to hide any subgroups.
To add rows:
- On the Rows tab, select Select account groups.
- In the Define report structure page, add the account groups that represent your Revenue and Expenses.By changing the account groups, you can easily compare locations by different accounts. For example, you might want to show "Assets," "Liabilities," or "Accounts Payable."
When you're done adding the 2 groups, the Rows tab is updated to show Revenue and Expenses with any subgroups indented underneath.
- To collapse the Revenue and Expenses account group, select the minus (-) sign to the left of each group.
- Select Save to save your progress with the report.
3. Filter account groups by dimension structure and set the detail level
While still on the Rows tab, you'll filter each account group by different dimension structures, such as by dimension structures that represent all customers and all projects. You'll then set the Detail level to show individual customers and projects.
"Dimension report structures" are named structures that are created for adding dimensions to the rows or columns of a financial report. You can add any number of report structures for the dimensions you track, including structures for locations, departments, customers, suppliers, items, projects, or even user-defined dimensions.
To filter the rows:
- If necessary, create the Customer structure and Project structure that you need for filtering.
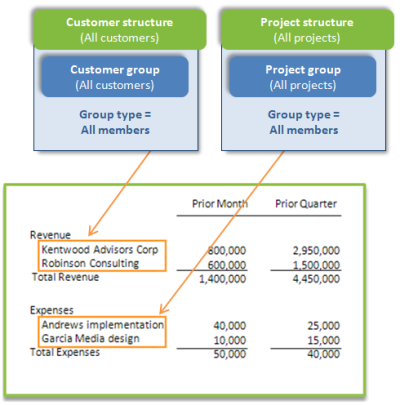
This example report uses 2 dimension structures:
- A Customer structure that contains a single group whose members are all customers.
- A Project structure that contains a single group whose members are all projects.
Learn how to create a dimension structure that contains all members.
- Set the dimension filter for the Revenue row.
- Locate the Revenue row and select the Filter by dimension structure column.
- In the Set dimension structure page, select Customer as the dimension and then select the dimension structure that represents all customers.
- For the same Revenue row, select the Detail level column and set the detail level to show individual customers.
- In the Choose level of detail page, select the Expand by dimension option.
- Choose the option to "expand by" Customers.
- Set the dimension filter for the Expenses row.
- Locate the Expenses row and select the Filter by dimension structure column.
- On the Set dimension structure page, select Projects as the dimension and then select the dimension structure that represents all projects.
- For the Expenses row, select the Detail level column and set the detail level to show individual projects.
- On the Choose level of detail page, select the Expand by dimension option.
- Choose the option to "expand by" Projects.
4. Create columns for different reporting periods
In this example, 2 actual columns are created to show revenue and expenses in the prior month and prior quarter.
To create the columns of your report:
- On the Columns tab, modify Column 2 by updating the Reporting period to the Prior month.
- Insert another actual column to the right, and set the Reporting period to the Prior quarter.
- Select Save to save your progress with the report.
Preview the report
To preview the report:
- From the Preview dropdown menu, choose Live Report (HTML).
Variations of this report
By changing the dimension structures that you use in columns, you can easily adjust this report to any dimension and any type of analysis that you want to perform.
For example, you might create dimension structures that enable you to look at:
- All customers, customers of a particular type, or a specific set of key customers.
- Items in the same product line or a particular set of items (such as your top-tier items).
- Projects by type or projects that have the same manager.
Control which dimension members are included
Often, you do not want to include all customers or projects. Based on the analysis you're trying to create, you might only want to see particular members, or members that meet certain filter criteria.
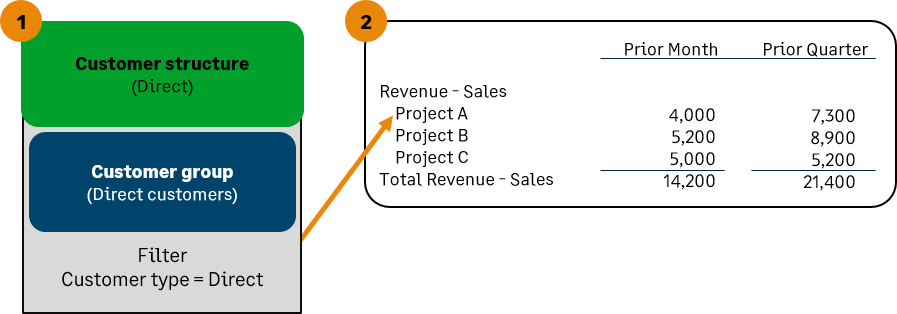
For example, you might want to see only your Direct customers or only Training projects. These types of dimension structures can be created by including a group that uses filters to select members. Learn how to create a dimension structure that represents a set of members.
Examine an account group by 2 different dimensions
You can also examine an account group by two different dimensions. In the graphic below:
-
Revenue is filtered for direct customers.
-
Revenue is expanded by project
To create this type of analysis in report rows:
- On the Rows tab, add the Revenue account group (or another account group).
- Click in the Filter by dimension structure column for the account group and filter it by dimension structure.
In this case, revenue is being filtered for direct customers. However, you could choose any account group and then filter it by any dimension structure.
- On the same row, select the Detail level column and expand by projects (or another dimension of your choice).
- Set the Detail level to Summary - hide accounts.
- Select the option to Expand by dimension.
- From the Dimension dropdown menu, choose Projects as your "expand by" option.
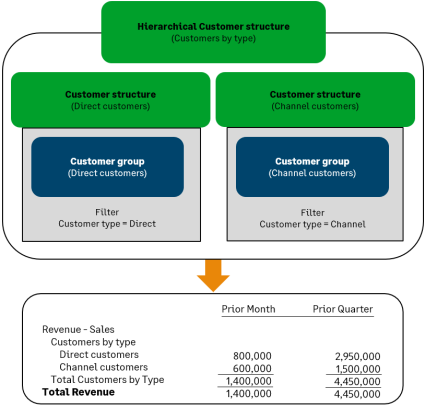
Use a hierarchical structure for more complex analysis on rows
You can also organize dimension structures into hierarchies, which gives you more options for organizing dimension data. In the following example, a hierarchical "Customers by type" structure includes 2 substructures that each filter for customers of a particular type (Direct vs. Channel).
To create this type of analysis in report rows:
- Create a hierarchical dimension structure.
Learn more about creating hierarchical dimension structures.
- On the Rows tab, add your account groups.
- Locate the row where you want to add your hierarchical breakdown. This row must contain an account group that either contains individual accounts or that selects accounts based on their category.
- Select the Filter by dimension structure column for the account group and select your hierarchical dimension structure.
- On the same row, select the Detail level column and set the detail level to show the dimension structure.
- Set the Detail level to Summary - hide accounts.
- Select the option to Expand by dimension, then select Dimension structure as your "expand by" option.