Locations across columns—Financial report example
Related information
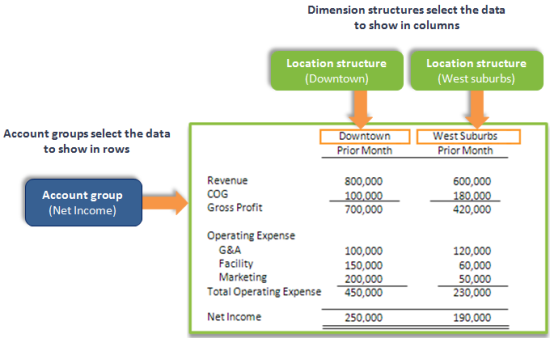
Use the Financial Report Writer to create a report similar to the one shown. In this example, report rows are built from account groups, such as the "Net Income" account group used in a typical revenue report. Across columns, dimension structures are used to create a column comparison between 2 locations.
This basic report structure can be used for any type of analysis. For example, comparing by members of different dimensions (such as items or projects) or creating more complex comparisons (such as by product line or project type).
To create a new financial report:
-
Go to General Ledger > All > Financial reporting and select Add (circle) next to Financial reports.
Create this report
There are 3 basic steps for creating this type of report:
- Select your basic report structure on the Report Info tab.
For this type of report, choose Accounts on rows in the Report structure section.
- Add account groups to your report rows.
Your account groups organize your accounts into hierarchies, allowing you to reflect how you report on assets, expenses, liabilities, and more. In this example, we're creating a Net Income report, but this method can be used to create any financial report.
- Create and select the dimension structures for your report columns.
This is where you add your custom analysis. You can create any number of re-usable dimension structures that correspond to how you want to slice and dice your data.
In this example, we're using dimension structures to create a location structure, choosing 2 different locations that we want to compare across columns, but this technique can be used to create any type of analysis. Location structures are a form of dimension structure. Learn more about variations of this report.
1. Select your basic report structure
When you create a new financial report, the Report info tab of the Financial Report Writer asks you to select a basic report structure. Based on your selection, the remaining tabs update to help you create that type of report.
To select your report structure:
- Create a new financial report.
- On the Report info tab, name your report.
- In the Report structure section of the Report info tab, select the option for Accounts on report rows.
2. Add account groups to your report rows
In this type of report, your rows are created by selecting the account groups that you want to appear on the left side of your report. An income statement is typically created by adding a single account group, often called "Net income," which contains subgroups for revenue and expenses.
To add rows:
- On the Rows tab, select Select account groups.
- On the Define report structure page, add your Net Income account group.By changing the account groups, you can easily compare locations by different accounts. For example, you might want to show "Assets," "Liabilities," or "Accounts Payable."
- Select Save to save your progress with the report.
The Rows tab is updated to show the account groups that you added.
3. Create and select the dimension structures for your report columns
Proceed to the Columns tab, and add dimension structures that correspond to the columns you want to see in your report rows.
"Dimension report structures" are named structures that are created to add dimensions to the rows or columns of a financial report. You can add any number of structures for the dimensions you track, including structures for:
- locations
- departments
- customers
- suppliers
- items
- projects
- user-defined dimensions
To create the columns of your report:
- Create the dimension structures that you need for the report.
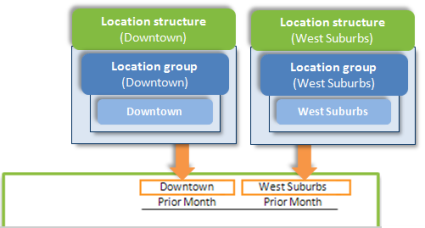
In this example report, 2 Location structures are used, each of which represents a different location.
The following graphic demonstrates how these dimension structures are built from a dimension group that includes a single member. Get step-by-step instructions on creating this type of dimension structure.
- On the Columns tab, modify Column 2 by updating the reporting period and selecting a Location structure.
- To select the Location structure, select in the Dimension structure field.
- On the Set dimension structure page, select Location as the Dimension and then select your first Location structure.
- Insert another column to the right, and then set up Column 3.
For this column, set the Dimension structure to the other Location structure.
- Select Save to save your progress with the report.
Preview the report
After you've selected dimension structures for the columns in your report, you're ready to preview.
To preview the report:
- From the Preview dropdown menu, choose Live report (HTML).
Variations of this report
By changing the dimension structures that you use in columns, you can easily adjust this report to any dimension and any type of analysis that you want to perform.
For example, you might create dimension structures that enable you to look at:
- All customers, customers of a particular type, or a specific set of key customers.
- Items by product line or a particular set of items (such as your top-tier items).
- Projects by type or projects that have the same manager.
Feature a dimension structure with multiple members
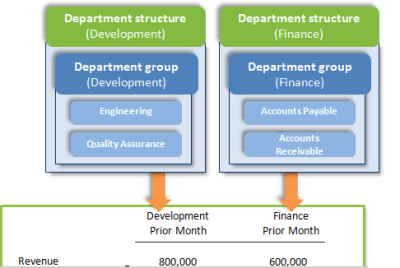
You can easily create dimension structures that contain multiple members of your choice. In the following example, the report compares revenue and expenses for the Development and Finance organizations. To create this comparison, each column is filtered for a Department structure that contains multiple departments.
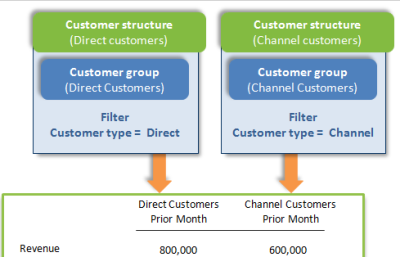
Often, a more efficient way to set up dimension structures is to use dimension groups that select members based on filters. In the following example, the report compares revenue and expenses for Direct customers and Channel customers. Rather than include each customer explicitly, the dimension structures are based on groups that filter based on the value of a field, in this case the Customer type.
Feature more complex analysis on columns
You can also organize dimension structures into hierarchies, which gives you more options for organizing dimension data and enables the display of total columns.
In the following example, a hierarchical "Customers by type" structure contains 2 substructures that each filter for customers of a particular type.
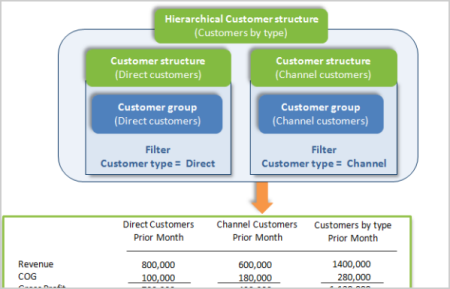
To create this type of comparison across columns:
- Create a hierarchical dimension structure.
Learn more about creating hierarchical dimension structures.
- In column 2, set the Dimension structure to the hierarchical structure that you created.
This sets the column to show amounts for your hierarchical structure, in this case "Customers by type."
- Use the Expand by option to split the single column into multiple columns using the hierarchy in the dimension structure.
From the Expand by dropdown menu, choose the option to expand by Dimension structure.
Expanding by dimension structure applies only to hierarchical dimension structures. For a flat dimension structure, such as a list of all customers or customers of a particular type, choose Customer from the Expand by dropdown menu instead.