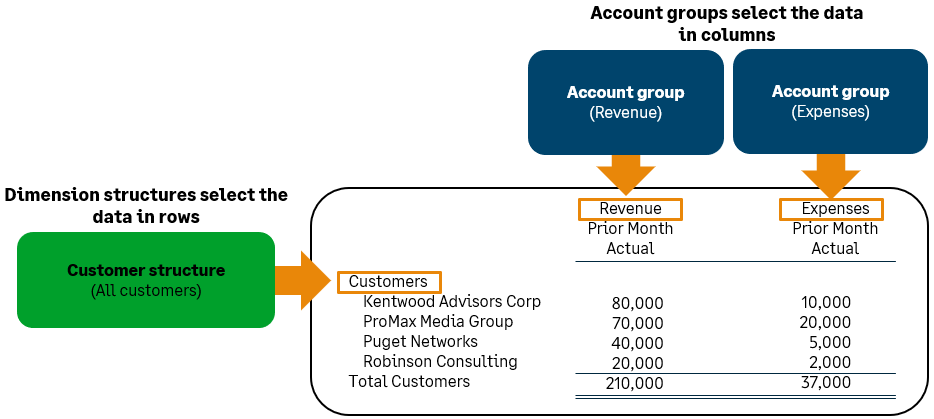
Customers in rows with account groups in columns—Financial report example
Related information
Use the Financial Report Writer to create a report similar to the one shown. In this type of report, the rows feature dimension data of your choice, instead of the traditional list of account groups and accounts. Across columns, account groups select the account data you want to see.
In this example, report rows contain a Customer structure whose members are all customers. The columns are used to report the Revenue and Expenses for each customer.
This basic report structure can be used for any dimension and any type of analysis. For example, selecting specific dimension members (such as particular customers), or creating more complex breakdown (such as customers by type or even top 5 customers).
To create a new financial report:
-
Go to Reports > All > Core and select Add (circle) next to Financial reports.
Create this report
There are 3-basic steps for creating this type of report:
- Select your basic report structure on the Report Info tab.
For this type of report, choose Dimensions on rows in the Report structure section.
- Create dimension structures and add them to your report rows.
- Select the account data to see in columns.
1. Select your basic report structure
When you create a new financial report, the Report Info tab of the Financial Report Writer asks you to select a basic report structure. Based on your selection, the remaining tabs update to help you create that type of report.
To select your report structure:
- Create a new financial report.
- On the Report Info tab, name your report.
- In the Report structure section of the Report Info tab, select the option for Dimensions on report rows.
2. Add dimension structures to rows and set your detail level
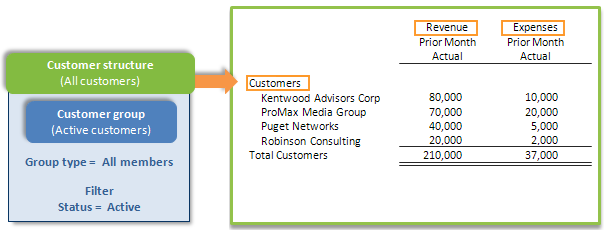
On the Rows tab, add dimension structures that correspond to the sections to see in report rows. In this example, we're using a Customer structure that includes all active customers, but this method can be used to create any type of analysis, such as a breakdown for selected projects, customers by type, items by product line, or a set of locations.
To select the dimension structures that form your report rows:
- If necessary, create the Customer structure that you need for report rows.
This example report uses a single Customer structure that includes all active customers. Learn how to create a dimension structure that contains all active members.
- On the Rows tab, select Select dimension structures.
- In the Define report structure page, add the Customer structure to the report.
After you've added the Customer structure, the Rows tab updates to list the single Dimension structure.
- Notice that the Detail level column lists specifies that the section will show Details. Individual customers in the Customer structure will be listed on the report, indented underneath the Customers heading.
- Select Save to save your progress with the report.
3. Select the account data to see in columns
Whenever you create a financial report, you must select the account data you want to see by choosing from your account groups. For this type of report, you're required to select account groups for the columns of your report.
In this example, 2 different account groups are used to compare the Revenue and Expenses for the same reporting period.
To select the account groups for your report columns:
- Go to the Columns tab.
By default, the report includes a column for Dimension name and 1 actual column.
- Select what you want to see in Column 2.
- Leave the Column type set to Actual.
- For the Reporting period, select Prior Month (or another period).
- For the Account group, select Revenue (or another account group).
- Add another column, and select what you want to see in it.
- Set the Column type to Actual.
- For the Reporting period, select Prior Month (or another period).
- For the Account group, select Expenses (or another account group).
- Select Save to save your progress with the report.
Preview the report
After you've selected account groups for the columns in your report, you're ready to preview.
To preview the report:
- From the Preview dropdown menu, choose Live Report (HTML).
Variations of this report
By changing the dimension structures in rows, you can adjust this report to any dimension and any type of analysis. For example, you might create dimension structures that enable you to look at:
- All customers or customers of a specific type.
- Items by product line or a particular set of items (such as your top-tier items).
- Projects by type or projects that have the same manager.
In this section, we'll cover how to adjust this sample report to:
- Control which customers are included.
- Show only the top or bottom members of a dimension, such as the top 5 customers by revenue.
- Show a finer breakdown of your account groups in columns.
Control which customers are included
Often, you do not want to include all customers. Based on the analysis you're trying to create, you might only want to see particular members, or members that meet certain filter criteria.
For example, you might want to see only your Direct customers. These types of dimension structures can be created by including a group that uses filters to select members. Learn how to create a dimension structure that represents a set of members.
Show the top or bottom customers
Often, you'll want to restrict the output of a financial report to show only the top or bottom of a particular set of dimension data. For example, you might want to include the top 5 customers by Revenue.
To adjust your report to show the top 5 customers by revenue:
- On the Rows tab, set the Detail Level for the Customer structure.
- Locate the Customer structure in your report rows, and select the Detail Level column.
- For the Detail Level, select Detail - show members and then use the Display matches dropdown menu to select top matches.
- Change the number of matches to 5.
Don't see the options for top or bottom matches in the "Choose detail level" page?If you select Detail-show members, but you do not see the options for top or bottom matches, make sure that Set detail level at the top of the Detail Level column is unchecked. The option for top or bottom matches is available for only individual structures.
In addition, you cannot use top or bottom matches if you select the option to Expand by another dimension.
- On the Columns tab, select the column used to determine the top or bottom match.
- To base the top 5 on revenue, select the Revenue column.
- Scroll towards the bottom of the column and select the Use for top or bottom calculation radio button.
Feature more complex analysis on columns
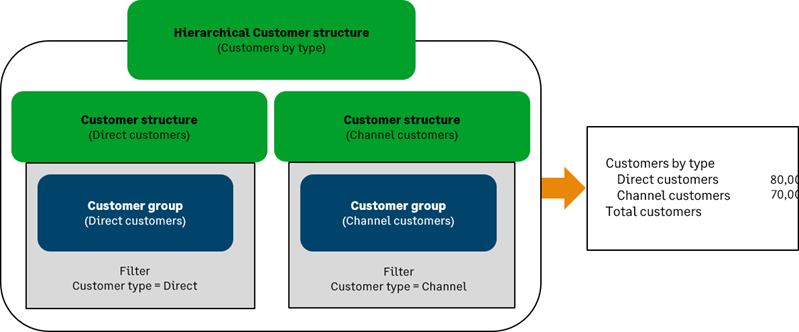
You can also create dimension structures based on a certain criteria and can even organize dimension structures into hierarchies.
In the following example:
- A hierarchical "Customers by type" structure includes 2 sub-structures that each filter for customers of a particular type.
- To create the rows on the report, "Customers by type" is selected as the Dimension structure for a particular row.
Expand a column by account group to show more detail
Suppose that you want to see a more granular breakdown of your Revenue. For columns that have an account group associated with them, you can Expand by the account group. For a hierarchical account group such as Revenue, this lets you show the groups within the account group.
To adjust your report to show Revenue expanded by account group:
- On the Columns tab, locate your Revenue column.
- Scroll down to the Expand by dropdown menu, and choose Account group.
- Notice that the Show option is set to show One level down.
- This means that the column will show the direct subgroups, in this example "Services" and "Subscriptions."
- You can also choose to show All levels, which would show any further subgroups.