Year-to-date profit and loss report—Financial report example
Related information
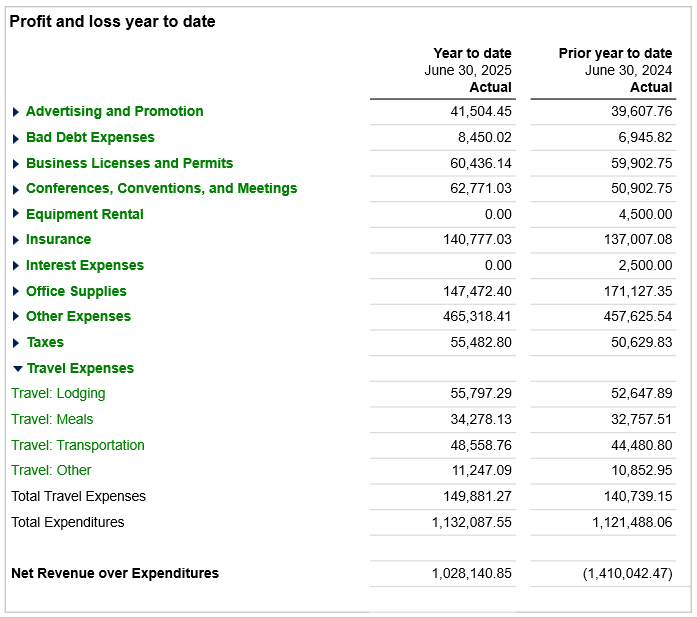
Use the Financial Report Writer to create a report similar to the one shown. In this type of report, the rows feature the traditional list of account groups and accounts. Across columns, account groups select the account data you want to see.
In the dropdown example, you see the actual profit and loss data for the year to date and for the prior year. If you have a budget in Sage Intacct, you can include a column with that for comparison as well.
To create a new financial report:
-
Go to General Ledger > All and select Add (circle) next to Financial reports.
Create the report
There are 3 basic steps for creating a P&L report:
- Select your basic report structure on the Report info tab.
For this type of report, choose Accounts as the Report structure.
- On the Rows tab, select the account groups and add them to your report rows. For Profit/Loss statements, select or create the Revenue and Expenses account group or its equivalent.
You might include a Revenue account group and an Expense account group separately, depending on your company setup. You could then create a Group of Account Groups containing both account groups. - On the Columns tab, select the account data you want to see in columns. For a Profit/Loss statement, you would likely want a minimum of the Account name and Actual columns.
Create your report structure
When you create a new financial report, the Report Info tab of the Financial Report Writer asks you to select a basic report structure. Based on your selection, the remaining tabs update to help you create that type of report. For a Profit and Loss report, select Account Groups.
- Create a new financial report.
- On the Report info tab, name your report.
- Place a check mark beside This report is active.
- In the Report structure section, select the option for Accounts.
Set your rows and detail level
Proceed to the Rows tab and set the level of detail for the sections you want to see in the report rows. For the Profit/Loss statement, we're using a single account group that contains Revenue and Expenses.
- Select Select account groups and choose the account groups to include in the report.
- On the Rows tab, select the account groups and add them to your report rows. For Profit/Loss statements, select or create the account grouping that contains your Revenue and Expenses account group or its equivalent.
If you do not have the account groups for revenue and expenses, create the account group fromBest practice is to create a range of accounts or a category instead of adding accounts to the group individually. This ensures that any accounts added later are included automatically. - Select OK.
- On the main Rows page, you can add further account groups here, but in most cases as long as you have Revenue and Expenses you will not need to add any more account groups. If you do need more, select Select account groups to add them.
- By default, the Detail level column lists specifies that the section will show Details. Individual accounts will be listed on the report, indented underneath the Account group (Revenue and Expenses) heading.
You can set the detail level for each account or for the entire account group. Optionally, select Set detail level… to change the detail level for all rows to Summary, which hides the individual accounts. It does not affect the data included in the report, only the level of detail you see. When you select Summary, you have the additional option of expanding by dimension.
Select Edit to change the detail level for a specific row. - Select Save to save your progress with the report.
Select the financial data to see in columns
Whenever you create a financial report, in addition to defining rows you must select the data you want to see by choosing and configuring the columns.
- Go to the Columns tab.
By default, the report includes the Column 1 as Account name and Column 2 as Actual. You can select other column type options in Column 1, such as Account number and name.
- Select what you want to see in Column 2.
- Leave the Column type set to Actual.
- For the Reporting period, select Current Year to Date.
- Select Save to save your progress with the report.
(Optional) Format the report
This step is optional but recommended.
- Go to the Format tab and select the Page setup and columns section at the top of the page.
- In the Report title, enter the title that appears on the report. This overrides the report name on the report.
- Include 1 or 2 subtitles, a comment, and footer text.
- Scroll down to fonts and change the font type and size for the different areas of the report.
- Set the page settings and other formats. Many companies find that adjusting the underlining feature can make reports easier to read.
- Select Save to save your report.
Preview the report
After you've selected the data for your report, you're ready to preview.
- From the Preview dropdown menu, choose Live report (HTML).
Set the report permissions
Define who should and should not see the report. Tab to Permissions and include or exclude users. See Permissions for more.
Save your report.
Variations of this report
By changing the column information, you can easily adjust this report to include more analysis. For example, you might:
- Expand by dimensions for comparative reporting, easily creating columns for the selected time periods or dimensions, such as Location or Customer.
- Include dimension structures to filter or group within a column.
- Include budget comparatives like a column for budget and a variance.
- Forecast results using computations or including forecast figures input into a budget version.
- Add prompts and filters.
Expand by a dimension
You might be interested in seeing which customers generate the most profit or which locations show the highest profit pr loss. Consider making subtle adjustment so applicable to both for profit and nonprofit You might be interested in seeing which customers contribute the most to revenue or which locations generate a profit, sustain, or operate with a loss. By expanding by a dimension, a column is automatically included for each selected dimension member, rather than having to build each one individually.
- On the Columns tab, find the Actual column for the current year to date and select the dropdown icon next to Expand by.
- Select the dimension to expand by. In the following, we selected Location.
- In the Show field, choose the level or rollup to display.
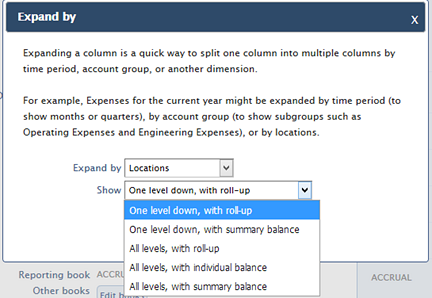
- Select Set.
- Save your report.
Include a budget column
Often, you'll want to see how the year to date actual amounts compare to the budget for context.
- On the Columns tab, hover over the Actual column title and select Add column right. Make sure that the column is directly beside the Actual column for the current year to date.
- Select the column type to Budget and then select the budget to use, for example Operating budget.
- Set the reporting period to match the one in Actual. In this case, it's Current year to Date.
- Select Preview > Live report (HTML) to see the report.
- Select Save to save your report.
Variances can be added by including a column with a type to show the Budget Variance or Difference or even as a ratio. Variances can also be calculated using the Summary on Column function.
Add the prior year-to-date column
Optionally add another column to see the comparison of the prior year-to date performance.
- On the Columns tab, hover over the last column number (either Actual or Budget) and select Add column right.
- Set the column properties.
- Set the Column type to Actual.
- For the Reporting period, select Prior Year to Date (or another period).
- Change the column title to Prior year to date actual or something similar, or leave it the same because the dates automatically will show last year.
- Select Save to save your progress with the report.
Forecast results
Optionally add another column or columns to forecast results.
- Add a column to represent the remaining period in the report timeframe.
- Set the column properties.
- Set the Column type to Budget and select a Forecast Budget
- For the Reporting period, select Future period (Next Month, Next Quarter, Next Year)
- Change the column title to Forecast or something similar
- Select Save to save your progress with the report.
Filter your report and add prompts
You can add prompts to your report so that at run time, the user running the report can select specific data to show, such as the date to report on. This is probably the most commonly used prompt. Another example is to prompt for a specific location or department, if you’ve included a prompt for that dimension.
To prompt for Location:
- The Actual for the current year Expand by was set to Location, One level down with rollup.
- On the Filters tab, place a check mark beside the Prompt option for Location. This requires the user to select the location when running the report.
- By default, the As of date is set to today.
When the user runs the report, that user is prompted for the specific location or dimension group to include in the report.
To filter for dimensions:
- On the Filters tab, go to the Define dimension filters section.
- For each dimension you want to filter, use the dropdown icon to select from the list. Select All <dimension> or Specific <dimension>.
- When you select Specific <dimension>, a second selection field appears. Select the <dimension> item to filter by. For example, if you select Specific Supplier, you’ll then select the supplier to include.
- Add additional dimension filters, if desired. However, the report will be filtered by all of the selections, so only data that matches all filters appears on the report.
- Save your report.