Sage Earth Carbon Accounting
Sage Earth helps you measure, manage, and reduce your company's carbon emissions. It simplifies sustainability and enables you to track progress toward net-zero carbon emission goals.
Sage Earth has developed a powerful API that enables businesses to calculate an industry estimate of their carbon footprint in seconds.
By understanding the factors that contribute to the carbon footprint, you can begin to make conscious decisions regarding your actions and purchases. Taking simple steps can lead to significant changes in the future.
Sage Earth only requires inputs of business revenue and industry sector to generate emissions for all scopes of the greenhouse gas (GHG) protocol (Scopes 1, 2 and 3, including all 15 emissions categories). Using the carbon emissions dashboard, your company can learn what ‘hot-spot’ areas require greater focus and can access Sage’s Net Zero Hub to learn how to take action in reducing emissions. The dashboard integrates with external APIs that fetch industry benchmarks and allow you to track their emissions data.
Install and configure Sage Earth Carbon Accounting
Before you can start using Carbon Accounting and the Industry Average Footprints dashboard, you need to install the software patch and take some steps to configure Sage Intacct to work with Carbon Accounting.
| Subscription |
Carbon Accounting |
|---|---|
| Regional availability |
United Kingdom |
| User type |
Business user with admin privileges |
| Permissions |
Company
Platform Services
|
Step 1. Add custom fields to be used in each of your entities
-
Go to Platform Services > All > Object customisation and select Add (circle) next to Custom fields.
-
Select Entity as the object to extend, and then select Next.
-
Select Picklist as the field data type, and then select Next.
-
Choose the picklist field characteristics, and then select Next.
-
In the Label field, enter Industry Sector.
-
Add the Pick values
Pick valuesCopyAccommodation (55000)
Advertising and market research (73000)
Air transport (51000)
Architecture and engineering, testing (71000)
Broadcasting (60000)
Building and landscape services (81000)
Business support activities (82000)
Civil engineering (42000)
Computer programming (62000)
Construction of buildings (41000)
Creative, arts, entertainment (90000)
Domestic goods and services (98000)
Domestic personnel (97000)
Education and recruitment (85000)
Electricity, gas, steam and aircon (35000)
Employment activities (78000)
Extraction of crude petroleum (06000)
Extraterritorial organizations (99000)
Farming and hunting (01000)
Film, music, TV production (59000)
Financial services (64000)
Financial services support (66000)
Fishing and aquaculture (03000)
Food and beverage services (56000)
Forestry and logging (02000)
Gambling and betting (92000)
Head offices and management consultancy (70000)
Human health activities (86000)
Information services (63000)
Insurance and pension funding (65000)
Land transport and pipelines (49000)
Legal and accounting activities (69000)
Libraries, museums, cultural (91000)
Manufacture electronic, optical products (26000)
Manufacture of basic metals (24000)
Manufacture of beverages (11000)
Manufacture of chemicals (20000)
Manufacture of clothes (14000)
Manufacture of coke and petroleum (19000)
Manufacture of electrical equipment (27000)
Manufacture of fabricated metal products (25000)
Manufacture of food products (10000)
Manufacture of furniture (31000)
Manufacture of glass, ceramics, cement (23000)
Manufacture of leather products (15000)
Manufacture of machinery (28000)
Manufacture of motor vehicles (29000)
Manufacture of other transport equipment (30000)
Manufacture of paper products (17000)
Manufacture of pharmaceuticals (21000)
Manufacture of rubber & plastic products (22000)
Manufacture of textiles (13000)
Manufacture of timber products (16000)
Manufacture of tobacco products (12000)
Membership organisations (94000)
Mining of coal and lignite (05000)
Mining of metal ores (07000)
Mining support service activities (09000)
Motor vehicle trade and repair (45000)
Other manufacturing (32000)
Other mining and quarrying (08000)
Other personal services (96000)
Postal and courier activities (53000)
Printing and recorded media (18000)
Professional, scientific, technical (74000)
Public administration (84000)
Publishing activities (58000)
Real estate activities (68000)
Remediation and decontamination (39000)
Rental and leasing activities (77000)
Repair and installation of machinery (33000)
Repair of computers and goods (95000)
Residential care activities (87000)
Retail trade (47000)
Scientific research and development (72000)
Security and investigation (80000)
Sewerage (37000)
Social work activities (88000)
Specialised construction (43000)
Sports, recreation, amusement (93000)
Telecommunications (61000)
Travel agency and related (79000)
Veterinary activities (75000)
Warehousing and transportation support (52000)
Waste collection, treatment, recycling (38000)
Water collection, treatment and supply (36000)
Water transport (50000)
Wholesale trade (46000) -
Select Sort list alphabetically.
-
In the Field ID field, type SAGEEARTH_INDUSTRYSECTOR
-
-
Choose the deployment options, and then select Done.
-
Leave the checkboxes deselected.
-
Leave the Section where field appears field blank.
-
In the Tab where field appears dropdown, select Entity information.
-
-
Stay on the Custom fields page.
-
Select Add, located at the top right of the Custom fields page.
-
Select Entity as the object to extend, and then select Next.
-
Select Number as the field data type, and then select Next.
-
Choose the number field characteristics, and then select Next.
-
In the Label field, enter Last Year Revenue.
-
In the Length field, enter 10.
-
In the Decimal places field, enter 0
-
In the Field ID field, type SAGEEARTH_LYREVENUE
-
-
Choose the deployment options, and then select Done.
-
Leave the checkboxes deselected.
-
Leave the Section where field appears field blank.
-
In the Tab where field appears dropdown, select Entity information.
-
Step 2. Download and install the Carbon Accounting patch
-
Download the Carbon Accounting patch file to your local hard drive.
-
Go to Platform Services > All > Platform tools and select Add (circle) next to Applications.
-
Select Install from XML from the options menu at the top of the page.
-
Select the patch file (Carbon_Accounting_1_5.xml) from the local directory where you downloaded it, and then select Install.
If this application has been previously installed, it will be updated to the newest version. -
After the confirmation page appears, select Done.
Step 3. Add the new module to the user profiles that will access Carbon Accounting
-
Go to Company > Admin > Users, roles, and groups > Roles.
-
Select the Subscriptions link for the role you want to update with Sage Earth Carbon Accounting access.
You can add Sage Earth Carbon Accounting to as many roles as required.
-
Select Carbon Accounting and then select its Permissions link.
If there is a long list of subscriptions, use the Ctrl-F Find function to quickly find Carbon Accounting.
-
Select All for each of the Carbon Accounting permissions.
-
Select the Industry Average Footprints Menu checkbox, and then select Save.
-
On the main subscription page, select Save again.
-
Refresh your browser.
-
Confirm that the Carbon Accounting menu item appears at the bottom of the Applications menu.
-
Confirm that Industry Average Footprints is available on the Carbon Accounting > All tab.
Step 4. Configure the Web Services user and allow the Content security policy
-
Go to Company > Setup > Configuration > Company
-
Select Edit, located at the top right of the Company information page.
-
Navigate to the Security tab, and select Add in the Web Services authorisations section.
-
In the Sender ID field, enter ajax
-
In the Description field, enter ajax
-
In the Status field, select Active.
-
-
Select Save.
-
Scroll down to the Content Security Policy section.
-
Add the following URLs to the list:
-
https://cdn.jsdelivr.net/npm/chart.js: The graphs library
-
https://cdnjs.cloudflare.com/ajax/libs/font-awesome: The icons library
-
https://acuity24-dev.netlify.app: The Acuity24 design library
-
-
Select Enforce content security policy.
-
Select the checkboxes for each URL as follows:
-
https://cdn.jsdelivr.net/npm/chart.js: Script
-
https://cdnjs.cloudflare.com/ajax/libs/font-awesome: Font, Style
-
https://acuity24-dev.netlify.app: Connect, Frame, Image, Media, Script, Style
-
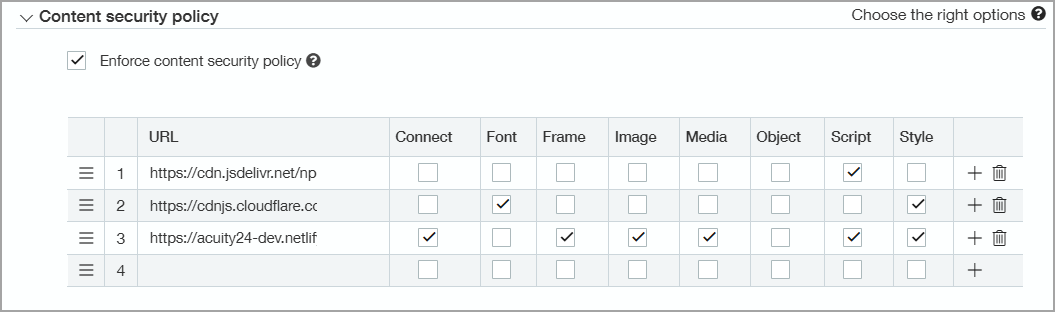
If your company has any other URLs listed in the Content security table, leave them in the table and add these URLs after the existing URLs.
Step 5. Configure your entities to use Carbon Accounting
-
Go to Company > Setup > Configuration > Entities.
-
Find the entity you want to set up and select Edit.
-
In the Industry Sector field, select the Industry.
-
In the Last Year Revenue field, enter the last year's revenue for this entity.
-
Repeat for any other entities for which you want to configure Carbon Accounting.
Access the Industry Average Footprints dashboard
Once you've installed the Sage Earth, the Industry Average Footprints dashboard will be available to all users with the appropriate permissions, determined by their defined roles.
To access the dashboard, go to Carbon Accounting > All > Components > Industry Average Footprints.
The dashboard displays the average Carbon Footprint for the specified industry sector associated with the entity. Additionally, it considers the revenue provided to calculate the carbon values.
About the Industry Average Footprints dashboard
Additional tabs are available as knowledge base (KB) resources that outline factors influencing the calculation of actuals for each Carbon Footprint scope. These resources are intended to illustrate and assist users in understanding the various contributors to carbon emissions. However, it is important to note that not all measures are considered by the Industry Averages Footprint API.
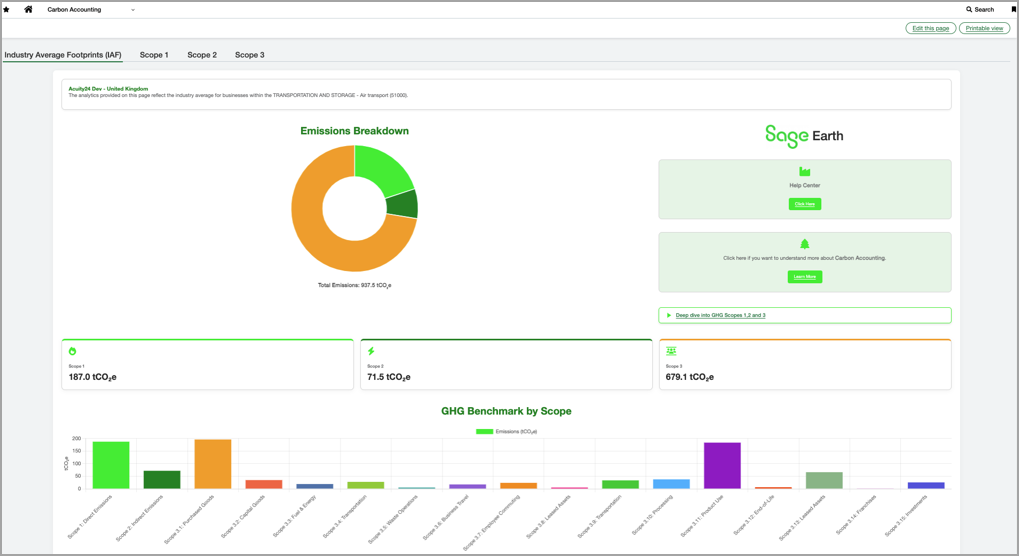
Dashboard Components
Doughnut Chart: Visualises the proportion of emissions across Scope 1, Scope 2, and Scope 3.
-
Data Source: API response containing benchmark data.
-
Customisation
-
Labels: Scope 1, Scope 2, Scope 3.
-
Colours: Green shades for Scope 1 and Scope 2, orange for Scope 3.
-
Tooltip: Displays emissions in tonnes (tCO₂e).
-
Bar Chart: Provides a detailed breakdown of emissions by scope and subcategories.
-
Data Source: API response with Scope 3 details.
-
Customisation
-
Labels: Scope 1, Scope 2, and Scope 3 subcategories.
-
Colours: A palette of distinct colours for each category.
-
Tooltip: Displays emissions in tonnes (tCO₂e).
-
KPI Cards: Displays total emissions for Scope 1, Scope 2, and Scope 3.
-
Data Source: Aggregated values from API response.
-
Customisation
-
Icons: Fire for Scope 1, Bolt for Scope 2, People for Scope 3.
-
Values: Converted from kilograms to tonnes.
-
Scope 1
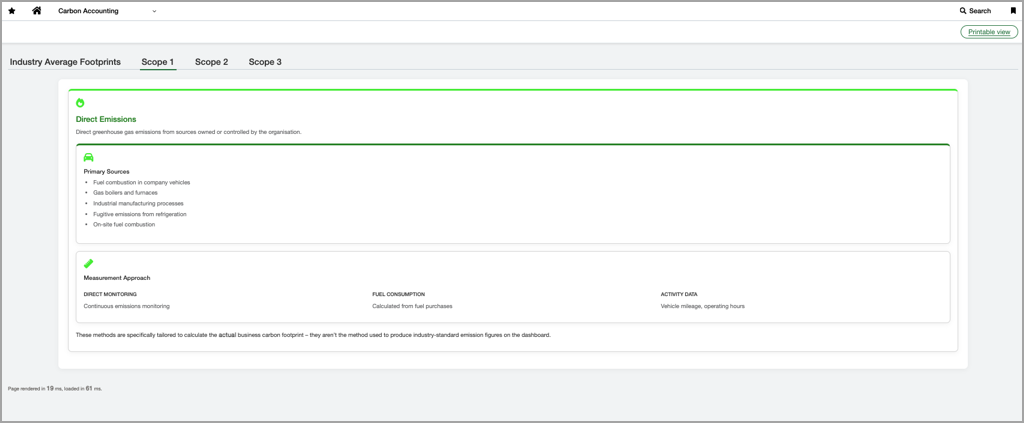
Scope 2

Scope 3

Technical details: Data input and API integration
Data input page
Entity information
-
Fields
-
Entity Name
-
Industry Sector
-
Industry Sector Code
-
Last Year Revenue
-
-
Purpose: Displays entity-specific data fetched from the API
API Benchmark Response
-
Field: Displays raw API response for debugging and transparency
API integration
Sage Earth API
-
Endpoint: Configurable via environment variables.
-
Request Payload:
-
Country Code
-
Industry Sector Code
-
Currency Code
-
Revenue
-
-
Response: Industry benchmark data for GHG emissions.
Supabase integration
-
Purpose: Tracks user interactions and data submissions
-
Payload
-
Entity, user, email, company details
-
Emissions data
-
Visualisation library
-
Library: Chart.js
-
Charts
-
Doughnut Chart
-
Bar Chart
-
Technical details: Front end, back end, and data mapping
Front end
HTML structure
-
File: carbonv4.html
-
Components
-
Charts (<canvas> elements)
-
KPI Cards
-
CTAs
-
Popup for entity selection
-
Styling
-
CSS Framework: Acuity24 Design Language.
-
External Libraries
-
Font Awesome for icons
-
JavaScript
-
File: Inline script in carbonv4.html
-
Global variables
-
doughnutChart, barChart: Chart instances
-
API_ENDPOINT: URL for Sage Earth API
-
-
Functions
-
readEntity(): Fetches entity data
-
makeApiCall(): Sends request to Sage Earth API
-
generateDashboards(): Creates charts based on API response
-
Back end
Netlify function
-
File: sageearth-industry-averages.js
-
Purpose: Handles API requests and sends tracking data to Supabase
-
Environment variables
-
SAGE_EARTH_ENDPOINT, SAGE_EARTH_CLIENT_ID, SAGE_EARTH_CLIENT_KEY
-
SUPABASE_URL, SUPABASE_KEY
-
Data mapping
Scope labels
-
Fixed mapping for Scope 3 subcategories
-
Example:
-
"3.1": Purchased Goods
-
"3.2": Capital Goods
-
Country to ISO3 mapping
-
Predefined dictionary for converting country names to ISO3 codes
Deployment
Hosting
-
Platform: Netlify
-
Files:
-
carbonv4.html: Main dashboard
-
carbonv4_data.html: Data input page
-
sageearth-industry-averages.js: Back end function
-
Environment variables
-
Required:
-
Sage Earth API credentials
-
Supabase credentials
-