Chart of accounts overview
Related information
Although everyone's accounts are different, Sage Intacct gives you the tools to capture the data that you need for reporting, while maintaining a simplified chart of accounts.
Types of accounts: Financial and statistical
There are two types of accounts in Intacct—financial accounts and statistical accounts. Financial accounts track monetary value. Statistical accounts track operational data (such as headcount) and can be used in combination with financial accounts to track metrics such as revenue per headcount.
Both types of accounts are found on the General Ledger menu, under Accounts.
The following graphic shows how these accounts can be used in a report to show financial and operational data together.
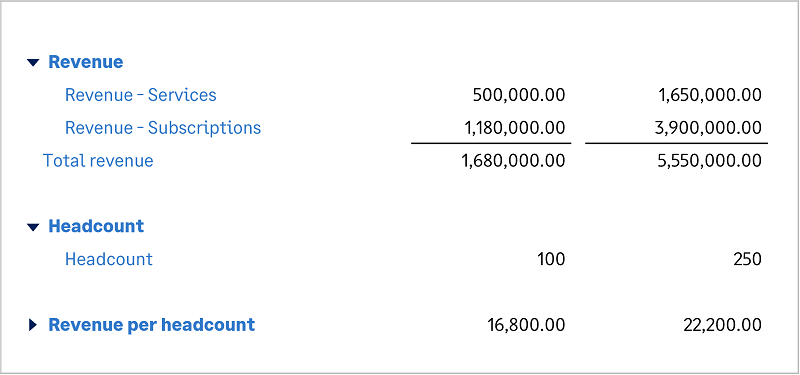
In this example, revenue per headcount is calculated using both financial accounts.
-
The Revenue section shows the revenue for services and subscriptions.
-
The Headcount section shows the total number of employees from the Headcount statistical account.
-
The Revenue per headcount section shows the result of dividing the total revenue by the headcount.
| Type of account | Description | Examples |
|---|---|---|
|
Financial accounts |
Accounts that hold monetary value and have a debit or credit "normal balance." |
Petty Cash Accounts Receivable Fixed Assets Accounts Payable Revenue -Services Expenses - Marketing |
|
Statistical accounts |
Accounts that hold a simple numerical value. Used to store business attributes. Typically used in ratios and other computations to evaluate business performance. |
Headcount Hospital beds Hotel rooms Square footage Shares outstanding |
Learn more about defining financial accounts and tracking statistical data.
How does Intacct simplify the chart of accounts?
Features such as dimensions and account groups enable you to maintain a clean chart of accounts, with just the accounting and operational data that you need to track.
Track through dimensions
Because department, location, and other information are tracked separately using dimensions, there's no need for duplicate accounts with different combinations of departments and locations.
In Intacct, you do this:
Expenses - PayrollBut not this:
Expenses - Payroll Dallas
Expenses - Payroll San Jose
Expenses - Payroll Phoenix
A dimension is a category of data that you can organize and sort in meaningful ways. Sage Intacct provides the following predefined dimensions:
- Location
- Department
- Class
- Customer
- Item
- Project
- Vendor
- Employee
- Warehouse (if you subscribe to Inventory Control)
- Contract (if you subscribe to Contracts)
In addition, Intacct enables you to define new dimensions to suit your needs. Use these user-defined dimensions to organize and sort categories of data unique to your business. For example, if you’re a software company with multiple product lines, you can create a user-defined dimension called Line of business. Then add the values Direct customers, Channel partner, and OEM.
Dimensions enable you to collect, sort, analyze, and report on data within one category, or between categories, so you can identify key factors such as:
- Your most profitable or most costly items or customers
- The return on investment of a project or department
- Whether and to what degree a new product or product line is successful
- Which way a particular aspect of your business is trending
- Intacct dimensions give you fine control over data definition and data hierarchy
With dimensions, you can customize financial reports around specific business activities, get greater visibility into how the business is doing, and make faster, more meaningful business decisions.
Think of dimensions as a more powerful alternative to subaccounts.
Additional fees can apply for the Project dimension and user-defined dimensions. Contact your account representative for more information.
Organize through account groups
Your chart of accounts is flat, without hierarchy. For example, individual expense accounts are not rolled up into "Expenses" or "Operating Expenses." Instead, the organization of accounts for reporting is done outside of the chart of accounts, using account groups.
An example chart of accounts can include:
Revenue - Services
Revenue - Subscriptions
Expenses - Marketing
Expenses - Payroll
Expenses - Utilities
These accounts are not included directly in financial reports, such as a Net Income report. Instead, financial reports are built from account groups, which organize accounts and determine where subtotals and totals are created.
The following graphic illustrates just one way that accounts can work together with account groups and dimensions in a financial report.
In this sample report:
- The highlighted accounts come from the chart of accounts.
- These accounts are organized into account groups, which create the groupings and totals on report rows.
- Columns are set up to compare by the location dimension.
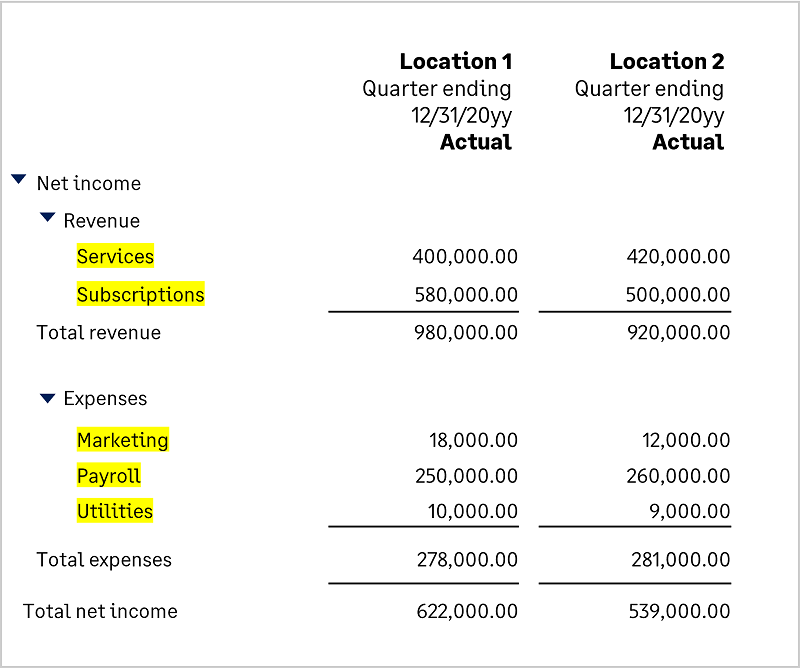
In this example, there are accounts in the Revenue and Expense sections:
-
The revenue section groups together the Services and Subscriptions accounts with the total revenue beneath them.
-
The Expenses section groups together the Marketing, Payroll, and Utilities expense accounts with the total expenses beneath them.
The total net income at the bottom of the report is calculated as total revenue minus total expenses.
Print the Chart of Accounts
| Subscription |
Company |
|---|---|
| Regional availability |
All regions |
| User type | Business |
| Permissions | Company Setup Checklist: Run |
You can print a list of the accounts in your Chart of Accounts so that you can see all the accounts your organization uses.
- Go to Company > Setup tab> Import data.
- Find Chart of Accounts and select View.
-
Select Export at the upper right of the page, then select the output type.
For printing, try the PDF option.
- When the file is complete, you can print it from your browser or save the file and print it from your computer.