Detail level for dimension structures: Rows tab—Financial Report Writer
By default, dimension structures are expanded to show detail, such as showing the individual customers in a Customer report structure. However, you can use the Detail level options to more finely control the level of detail or to further break down the data.
In this topic, you'll find information about:
- Where does the dimension detail appear?
- Choose between details and summary
- Show the top or bottom members only
- Expand by another dimension
- Expand by account group
Where does the dimension detail appear?
The choices that you make for detail level determine the rows that appear in the report.
The dimension structure names and detail are displayed in a single report column, which has the type "Dimension name." By default, the "Dimension name" column is the leftmost column on the Columns tab of the report (Columns tab > Column type > Dimension name).
Choose between details and summary
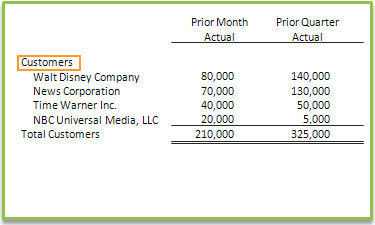
- Details - show members: Shows individual members in the dimension structure, such as showing individual customers in a Customer structure. When you choose to show details, you also have the option to limit the number of members shown to the top or bottom based on a column of your choice.
- Summary - hide members: Hides individual members, showing a summary amount only for the dimension structure. For hierarchical dimension structures, summary amounts are also shown for the substructures.
Show the top or bottom members only
Often, you'll want to restrict the output of a financial report to show only the top or bottom of a particular set of dimension data. For example, you might want to include the top 5 customers by revenue.
This option appears only if you are creating a report with dimension structures on rows and account groups on columns.
To show the top or bottom members only:
- For the Detail level, select Detail - show members and then use the Display matches dropdown menu to select whether you want to show top or bottom matches.
By default, we use 10 as the number of matches, but you can enter any number.
- On the Columns tab, select the column that should be used to determine the top or bottom match.
- You can select any Actual or Budget column on the Columns tab. For example, if you're looking for the top customers by revenue, you might want to select an Actual column for the previous month's revenue.
To choose the column you want to use, scroll towards the bottom of the Columns tab and select the Use for top or bottom calculation radio button.
Learn more about using top and bottom matches in financial reports.
Expand by another dimension
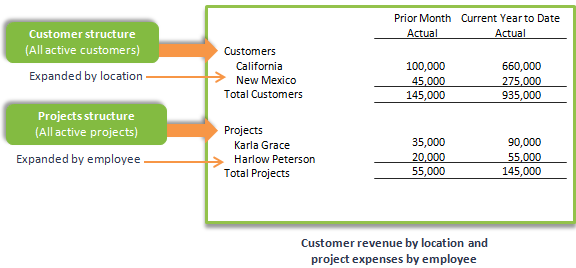
You can expand a dimension structure by another dimension, which adds additional rows for the selected dimension. For example, the following report includes a Customer structure that has been expanded by location (to show customer revenue by location) and a Projects structure that has been expanded by employee (to show project expenses by employee).
To expand by another dimension:
- Set the Detail level to either Detail - Show members or Summary - Hide members.
This option determines whether you want to see the members of the dimension structure, such as the customers in a Direct Customers structure. Choosing Summary - Hide members would display a summary amount only for Direct Customers.
- Select the option to Expand by another dimension.
- From the Dimensions dropdown menu, select the dimension.
- Use the Show dropdown menu to choose how much of the dimension hierarchy to display.
Because many dimensions are hierarchical (for example, a US location might be organized by state, with additional locations in certain cities), the Show dropdown menu allows you to choose:
- How many levels to show.
- Whether amounts or reported individually, or with amounts "rolled up" from levels below it.
The following table describes each option, and provides examples.
| Option | Description |
|---|---|
|
One level down, with rollup |
Displays rows that contain summary amounts for one level only. For example, suppose that you have locations in California, New York, and Florida. In addition, California has sublocations for Northern California and Southern California. In this case, the report:
|
|
All levels, with rollup |
Displays rows that contain summary amounts for each level. For example, suppose that your California location has sublocations by city. In this case, the report:
|
|
All levels, with individual balance |
Displays all levels, but with each level showing only the individual amounts assigned to that level. For example, suppose that your California location has sublocations by city. In this case, the report:
In the case of expenses, for instance, the row for "California" would include only expenses attributed directly to California and would not include amounts from any city in California. |
|
Leaf amounts, all levels |
Displays only the lowest levels of the hierarchy, For example, suppose you have a location in Arizona with no sublocations, but you also have a location in California, with sublocations in Los Angeles and San Jose. Choosing "Leaf amounts, all levels," would include rows for:
What's a "leaf"?
In account groups, the leaf is the lowest account group level that has accounts assigned to it. For example: Net Income (group of groups)
Revenue (group of groups)
|
|
Leaf amounts, one level down |
Displays only one level, but includes amounts from only the lowest levels. For example, suppose you have a location in Arizona with no sublocations, but you also have a location in California, with sublocations in Los Angeles and San Jose. Choosing "Leaf amounts, one level down," would :
|
Expand by account group
For reports that have account groups selected on the rows of the report, the Expand by another dimension option also gives you the option to expand by account group. For example, you might decide to display Revenue for a Customer structure and then expand by account group to show additional rows for Revenue: Subscriptions, Revenue: Software, and so on.
To expand by account group:
- Set the Detail level to either Detail - Show members or Summary - Hide members.
- Select the option to Expand by dimension.
- From the Dimensions dropdown menu, select Account group.
- Use the Show dropdown menu to choose how much of the account group hierarchy to display.
Because many account groups are hierarchical, the Show dropdown menu allows you to choose how much of the hierarchy to show.
For the purposes of example, suppose you have the following account group:
- Assets
- Current Assets
- Cash and Cash Equivalents
- Other Current Assets
- Accounts Payable
- Inventory
- Fixed Assets
- Current Assets
| Option | Description |
|---|---|
|
One level down |
Displays summary rows for one level only. For example, suppose that you filter by Assets, as shown in the example. In this case, the report:
|
|
All levels |
Displays summary rows for all levels, using indentation to represent the hierarchy. |
|
Leaf amounts |
Displays only the end points of each branch of the hierarchy. For example, using the same Assets account group, the report would include amounts for these groups:
What's a "leaf"?
In account groups, the leaf is the lowest account group level that has accounts assigned to it. For example: Net Income (group of groups)
Revenue (group of groups)
|