Compare expenses across periods—Financial report example
Related information
Financial reports generate data relative to the as-of date. This could be the current date or a different one that you enter when running the report, such as the prior month end. To get a picture of how data changes over time, you can create reports that compare information for multiple periods.
The examples in this topic include a monthly report and a quarterly report, and you'll see 2 different ways to set up your columns for multiple periods.
Create the report
-
Go to Reports > All > Core and select Add (circle) next to Financial reports.
The Financial Report Writer opens and shows the Report Info tab.
-
Enter a Report name.
-
Select This report is active.
-
For the report structure, select Accounts.
Add rows to the report
Because you selected Accounts as the report structure, you'll add account groups to determine which accounts show in the rows on the left side of the report. The goal is to compare expenses across time periods, so select the expense account groups.
-
In the Financial Report Writer, go to the Rows tab.
-
Select the Select account groups button.
-
If you've already set up an Account group purpose to tag your expense accounts, select it. This will narrow down the accounts that appear in the Account group list.
-
Select an expense Account group and then select Include in report.
Repeat this step for all expense account groups needed in the report.
The report lists the account groups in the order shown in the Account groups to include in report section. To reorder them, select and drag the Move icon ( ) to the right of the account group.
 -
Select OK.
Add columns to the report
Your report has 2 columns by default. The first column shows the accounts and the second column shows data for the default reporting period.
The next step is to add columns to show expenses for different reporting periods. There are several reporting period options to choose from. The columns can reflect data for a week, month, quarter, or year.
There are 2 ways to set up columns for additional periods:
-
Offset: Use the offset option to compare data over a series of time periods, such as months or quarters.
You can also use offset for same-day comparisons across periods. For example, compare expenses through the current month of the current year to the current month of the prior year.
Use any current period offset for the greatest flexibility in reporting. -
Expand: Use the expand option to expand a given reporting period into smaller units in separate columns. For example, expand a quarter into months or expand a month into weeks.
Expanding by time period works only when the report is run for "This week" and current periods, such as current month, current quarter, and current year. You can expand by time period in combination with the offset option—for example, "Current quarter" offset by 1 prior period.
Using the Expand option generates new columns in the report output. If you use a Summary on Columns computation that follows an expansion, ensure that the computation accounts for the fully expanded number of columns.
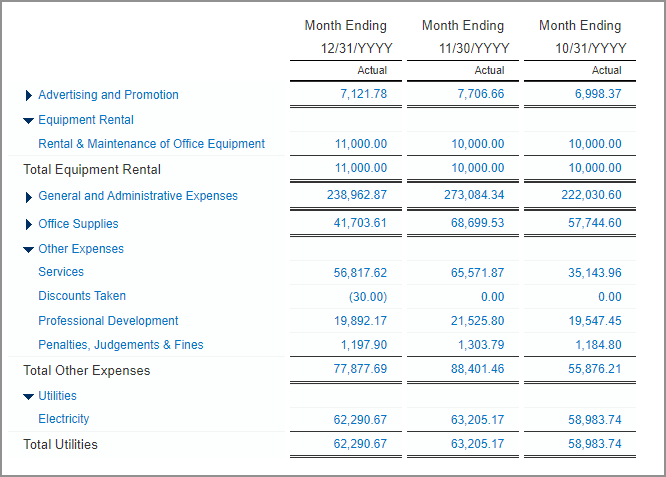
Use the offset option to compare expenses over 3 months
-
In the Financial Report Writer, go to the Columns tab.
-
Review and accept the default selections for the first column.
-
Select column 2.
-
In the Reporting periods field, select Current month.
-
Accept the other default selections.
-
Select the Column 2 heading, and then select Add column right.
-
In column 3, in the Offset field, enter 1 and then select Prior periods.
This tells Intacct to show data from 1 period prior to the current month.
-
Select the Column 3 heading, and then select Add column right.
-
In column 4, in the Offset field, enter 2 and then select Prior periods. This tells Intacct to show data from 2 periods prior to the current month.
-
Select Save.
Preview the report to see the results. Enter an As of date, and then select Preview > Live report. You'll see a report similar to the one in the following example.
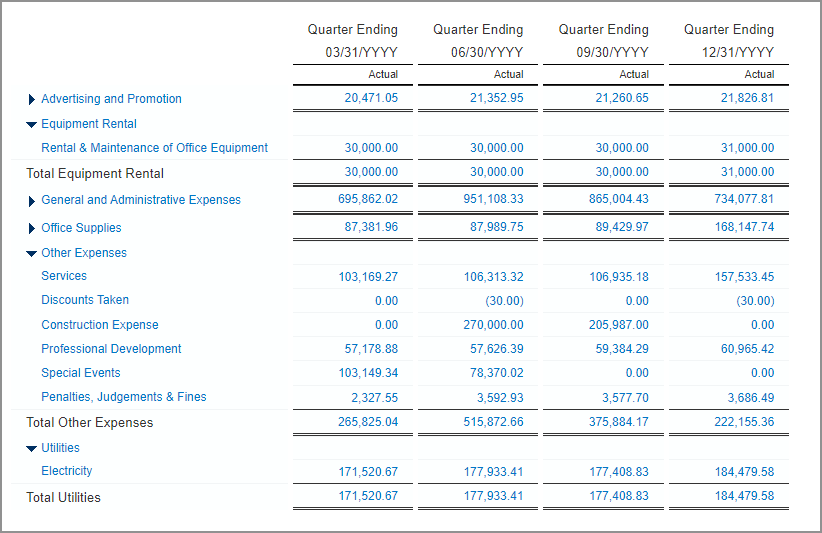
Use the expand option to expand data for the full year
-
In the Financial Report Writer, go to the Columns tab.
-
Review and accept the default selections for the first column.
-
Select column 2.
-
In the Reporting periods field, select Current year.
-
In the Expand by field, select Time period.
-
In the Show field, select Expanded quarters.
-
Select Set.
-
Select Save.
Preview the report to see the results. Enter an As of date, and then select Preview > Live report. You'll see a report similar to the one in the following example.