Top tip: filters
Related information
If a report doesn't display as expected, there are steps you can take to troubleshoot the issues. However, you can shorten the time it takes to get the desired results, if you know what to look for.
Conflicting or mismatched filtering is probably the most common reason that reports do not appear the way you expect or appear to have conflicting information. Filters are the first place to look when troubleshooting your reports.
In many cases, the report is running the way it should, but there's a filter being applied that's not obvious.
Here's where you get to be a detective. There are multiple issues that can cause reports to need a bit of troubleshooting. Understanding how the filters work, where to find them, and how to determine if filters are the root cause takes a little digging but is the first place to look.
Where are the filters located?
Filters can be applied in multiple locations, each with its own reason. The following table describes what the filters are and where to find them. As you can see, finding a filtering issue can require some digging.
| Filter | Where to look |
|---|---|
|
Account groups |
Account groups are used with financial reports and have filtering of their own. When you create or edit an account group, the default is to have no filter for each of the dimensions. You can select specific dimensions with or without subdimensions: departments, locations, or classes. You can filter the group for only the dimensions that have no instance of the dimension included in the group information. For example, all accounts that have no department or employee. This is the filter described in No <dimension> specified. Access report filters for account groups from General Ledger > All > Accounts > Account groups. |
| Custom reports |
The Filter your report step in the Custom Report Writer provides a method for additive filtering on a report. The exact information in the filters will differ, but you can use combinations of columns, operators, and values. These are explained in detail in Report filters and Refine filters. Some filters are applied directly to a report, from the report filtering. Other filters can be used on setup components that are included in reports, such as account groups and dimension groups. Access the Custom reports from Reports > All > Advanced > Custom reports. |
| Dashboards |
You can include filters on a dashboard and its individual components. Selections for available filters are set at Dashboards > Dashboard properties. |
| Dimension groups |
Dimension group is a name for particular set of members in a dimension, or a set of members that meet certain criteria. For example, you might create customer groups for a particular set of customers, customers located in a particular state, territory, or even customers with the greatest open balance. In financial reports, dimension groups can be used in several ways:
Separate dimension group list for each type of dimension, also specific dimension groups in the Setup section of their owning applications. For example, to find the Customer Groups list, go to Accounts Receivable or Order Entry > Setup > Customers > Groups. |
| Dimension structures |
You can add any number of structures for the dimensions you track. Access Dimension structures from General Ledger > Financial report structures > Dimension structures. |
| Financial Report Writer |
The Filters tab of the Financial Report Writer is an efficient place to filter financial reports. Access the Financial Report Writer from Reports > All > Core > Financial reports. |
| Permissions | Permissions are included across multiple applications. |
| Prompts | This type of prompt appears when you run a report. |
First step
The fastest way to see if there are filters on a report is to drill down and run the General Ledger report on which the financial report is based. When you run the General Ledger report, you can see if any filters exist. Running the General Ledger report requires permissions to see all the underlying data.
- Run the financial report in question, selecting HTML as the way to view it.
- Select the link for the amount in question. This generates the General Ledger report.
- Select Customize to open the report options and scroll down to Dimension filters.
- Review the filters that are selected. Look at the Include subdimensions checkbox for each filter.
It could be that a subdimension has additional restrictions or was not included in the report. Select or deselect Include subdimensions and run the report again to see if that corrects the issue.
To determine if an account group has filters:
- Go to General Ledger > All > Financial report structures > Account groups.
- Find the account group in the list.
-
Select More actions > View at the end of the row.
- Expand the Report filters section to see any filters for the account group.
- Go to General Ledger > All > Financial report structures > Account groups.
- Find the account group and select View.
- Expand the Report filters section to see any filters for the account group.
Looking for filters
If you ran the General Ledger report and discovered that a filter already exists in the report but also in another area, what now?
- Determine which filter is likely causing the confusion.
- Remove the filter from the likely source of the problem.
- Run the report until you're satisfied that it's configured the way you want.
Filters on setup components like account groups and dimensions are applied before the data gets to the report, while filters included in the report itself are applied after the data is gathered. This affects not just the report results, but can affect the size of the report and even the performance.
Other common filtering issues
The following table shows some symptoms that might appear and the likely cause.
| Symptom | Cause | Possible solution |
|---|---|---|
| The report is not including child locations |
Filters in the account group that are applied before the report is generated. |
Check the account groups setup for filters applied there. |
| Budget drill-down amounts do not match |
Calculation methods per account are derived from the Account Type Account Group and can be impacted by the Column selection for Calculated. |
|
| Other drill-down items do not match | Usually caused by multiple or conflicting filters. Understand filters applied both in the report directly and in the account groups used in the report can conflict. Filters might not be applied in the order you expect. |
Check to see if the account groups used in the report are using filters. After you know what filters are applied, adjust to correct the mismatch. If you're still not sure, apply the same filters and dates on a trial balance report. |
| Amounts on financial reports are incorrect or do not match the GL | In most cases, discrepancies in amounts are caused by filtering applied to the report or a component of the report. |
Make sure you understand how filtering is applied. |
| Amount in columns does not match the total | Calculation methods might be applied as For period in one place and Ending Balance in another. | For period shows only net changes. Ending balance shows the total balance at the end of the period. If these do not match, the totals will not match, either. Both are valid, but they must match across the report. |
| Some dimensions incorrectly appear or do not appear in the report |
Dimensions are often hierarchical. For example, a department can have one or more child departments, up to several levels deep. When a report filter includes a member of a dimension, data from any members that belong to it will also be included. This means that a department group that matches the Engineering department will automatically include data from any subdepartments (such as Development, Quality Assurance, and Documentation.) |
Check your dimensions to see if they have sublevels that might be affecting the report. |
|
Why doesn't my report include transactions in which the dimension is not specified? |
Reports will not include any transactions that are not tagged with the dimension you're filtering for. |
If you use the Filters tab to filter for a department group:
|
| I want to include inactive dimension members in financial reports |
It's common to deactivate dimension members that you no longer need, such as particular departments, projects, or vendors that you're no longer using. However, you might still need to include related financial information on reports. |
In this case, you can create a dimension group that filters on active and inactive dimension members, and use that group to filter your financial reports. |
Best practices for filtering financial reports
When you generate a report, the data that's included is based on what you add to your rows and columns, and any filters that you apply.
- All financial reports include account groups, which indicate which accounting data to include in the report.
For example, a balance sheet might include account groups for "Assets" and "Liabilities & Equity." These account groups can include filters in their definitions, although this isn’t recommended in most cases.
- Financial reports can also include dimension structures that represent a set of dimension data to include on rows and columns.
For example, you might want your rows or columns to include selected departments, customers by type, or items by product line. By nature, these dimension structures limit the data to be displayed in the report.
- Additionally, you can apply report-level filters on the Filters tab.
For example, you might filter a report for a particular location or a location group that includes a specific set of locations.
In general, filters that you add to the Filters tab and filters on account groups are applied first, followed by any other filtering. For maximum flexibility, it's recommended that you don't use account group filters.
When defining reports, it's best to keep your approach simple. This avoids situations in which there's a conflict between the data on rows and columns and any filtering you've applied.
Here are some recommended best practices:
- Avoid adding filters to your account group definitions.
Although you can define filters for an account group, such as filtering a Cost of Goods Sold account group for a particular location. It is recommended that you don't add any filters to account groups.
Instead of filtering your account groups:
- Define your account groups without filters.
- On a report-by-report basis, use the options available in the Financial Report Writer to select the data you want to see.
- When filtering for a specific set of members (or members that meet certain criteria), define your filters in only one place.
In general, avoid situations in which you select one set of dimension data on rows and columns, and then set a report-level filter that includes a different set of data.
Instead, do either of the following:
- Apply filters on the Filters tab: To filter the entire report for a specific set of dimension data, you can select one or more dimension groups on the Filters tab. For example, you might filter a report for "West Coast locations."
OR
- Select and filter data on the Rows and Columns tabs: On each tab, you can select the data you want to see in your rows and columns. Depending on the type of report you’re creating, different options will be available. For example, you could add Cost of Goods sold to your report rows and then create columns that compare by different locations.
- Apply filters on the Filters tab: To filter the entire report for a specific set of dimension data, you can select one or more dimension groups on the Filters tab. For example, you might filter a report for "West Coast locations."
Multi-entity companies
The following filter options appear only if you work in a multi-currency and multi-entity environment.
- To filter the report by geographic location, enter the name of the region, country, state or province, or city in the Location field. Location is required to run this report at the top level. The location that you specify is used to determine the appropriate currency.
- To filter the report by department within the company, enter the name of the department in the Department box.
- To cover certain locations regardless of what you select in the Location field, use the Show For field. To override the selection in the Location field, move to the Show For field and select the down arrow. Select the location options to include in the report. Where you are in the organization affects what the report includes.
- All locations: include data for all locations regardless of the entity that you're currently using.
- This Location: include data only for the entity or child location that you're currently using.
- Child locations: include data only for locations that are child locations of your current entity.
Examples
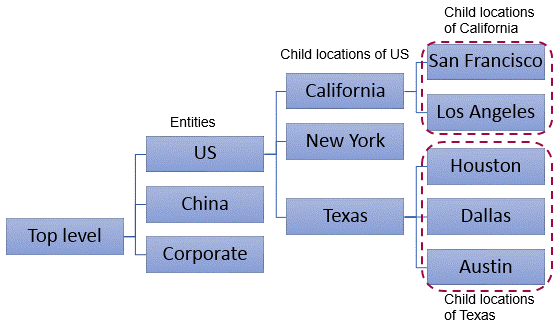
Suppose you have 3 entities: US, China, and Corporate.
- The US entity has child locations for California, New York, and Texas.
- California has child locations for San Francisco and Los Angeles.
- Texas has child locations for Houston, Dallas, and Austin.
- China and Corporate have no child locations.
| If you are in... | ... and select | the report includes |
|---|---|---|
| Top level | All locations | all entities, locations, and child locations |
| This location | all entities, locations, and child locations | |
| Child locations | California, New York, Texas, San Francisco, Los Angeles, Houston, Dallas, Austin | |
| US | All locations | California, New York, Texas |
| This location | US only | |
| Child locations | California, New York, Texas, San Francisco, Los Angeles, Houston, Dallas, Austin | |
| Texas | All locations | All locations |
| This location | Texas only | |
| Child locations | Houston, Dallas, Austin | |
| China | All locations | All locations |
| This location | China only | |
| Child locations | nothing |