Sage AI and Automation
Close analytics—Early Adopter
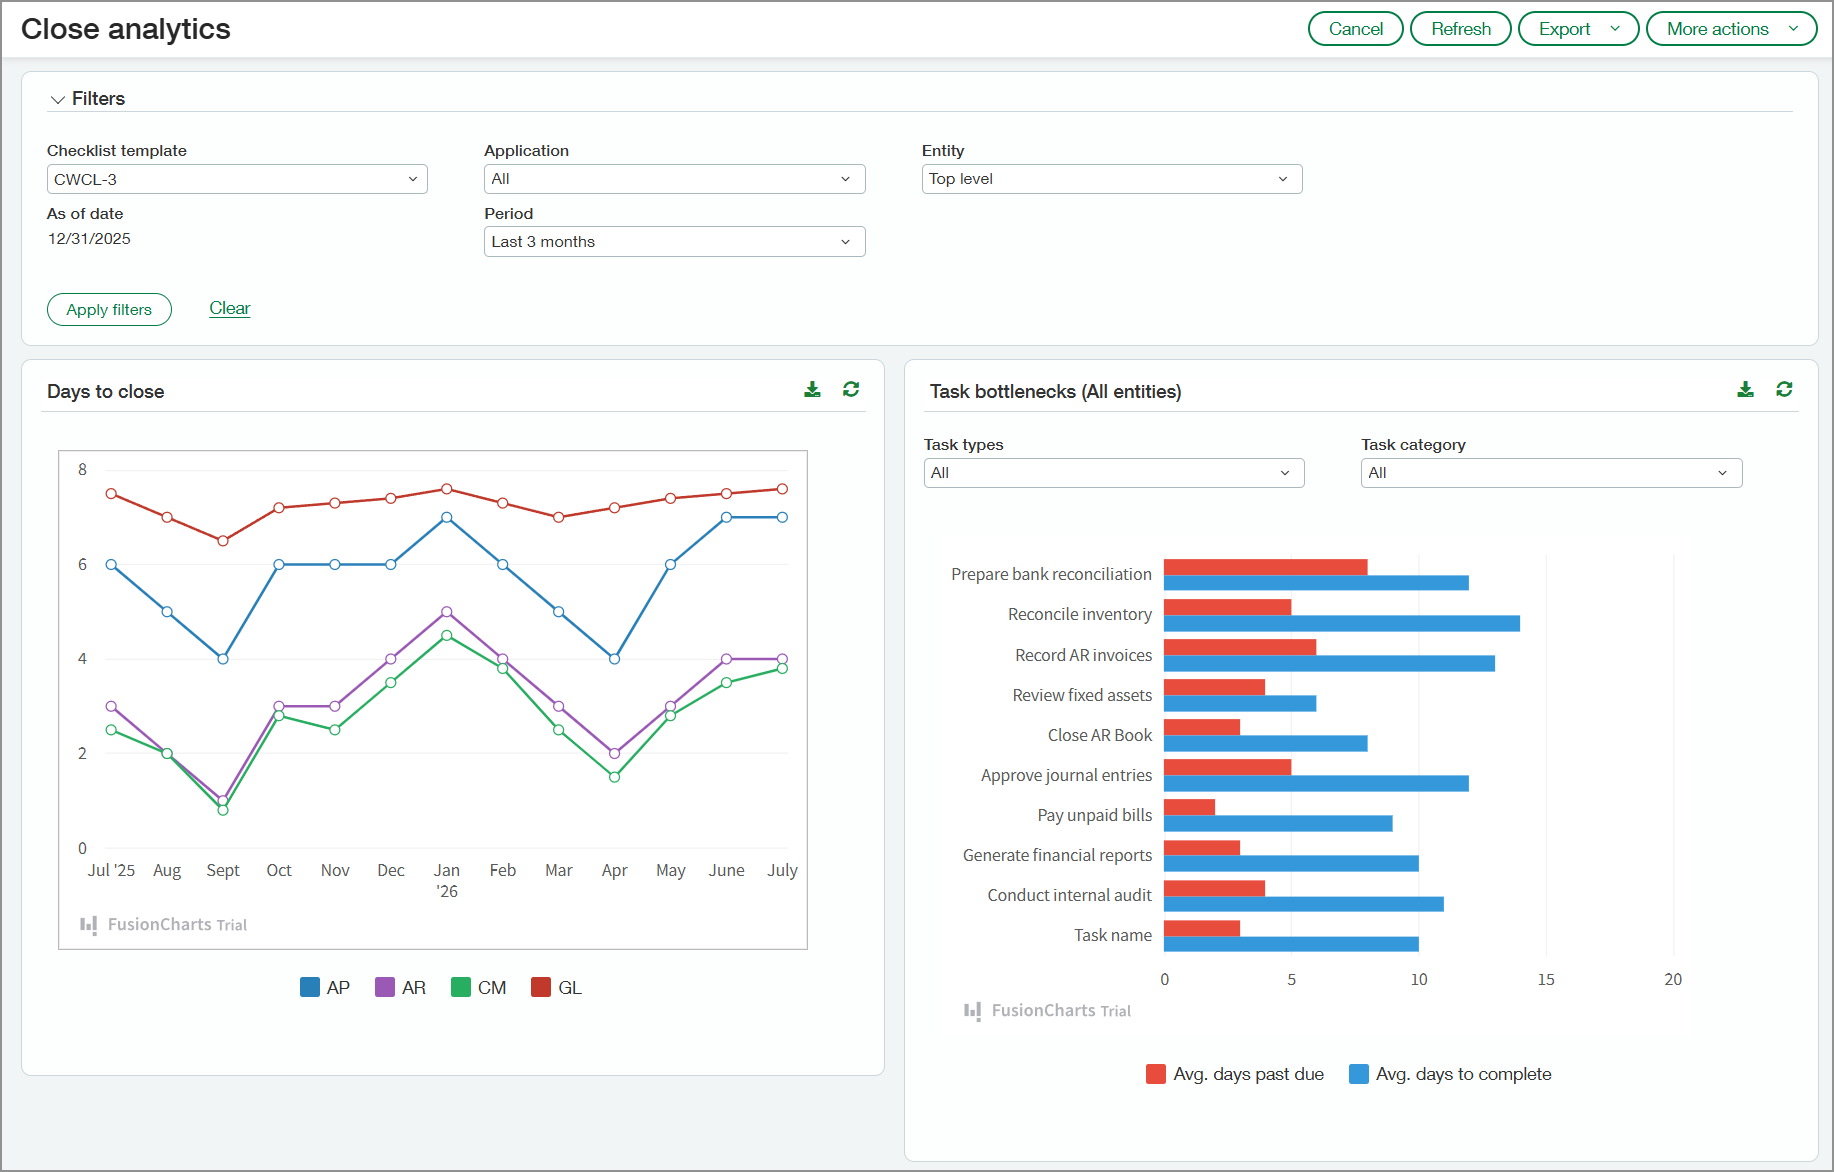
Close analytics is a new feature within Close Automation that empowers finance professionals with actionable insights into the close process. Close analytics reveals patterns, bottlenecks, and opportunities for process improvement. Your team can use this information to optimize their record-to-report close process without manual analysis.
Key benefits
-
Monitoring close-related task delays can help managers identify recurring issues so that they can be addressed in future periods.
-
Real-time visibility into task ownership, deadlines, and dependencies helps managers coordinate activity more effectively, reduce delays, and ensure a smoother close process.
-
By analyzing historical trends in adjustments and reclassifications, managers can uncover inefficiencies and address recurring issues to streamline the close process.
-
Insight into transactions that are automatically matched during reconciliation versus those that are manually matched can help managers refine matching rules. This can reduce manual effort and speed up the reconciliation process.
-
Visibility into bill entry patterns—including manual entry versus automated entry—helps managers identify inefficiencies and optimize resource allocation.
How it works
To review your Close analytics data:
-
Go to Close Workspace > All > Close analytics.
-
Select options in the Filters section as needed.
The filters will be applied to all sections of the page.
-
Select Apply filters.
Close analytics captures information from the following applications if they're used by your company:
-
Accounts Payable
-
Accounts Receivable
-
Cash Management
-
General Ledger
What you'll see
The following sections describe what you'll see on the Close analytics page.
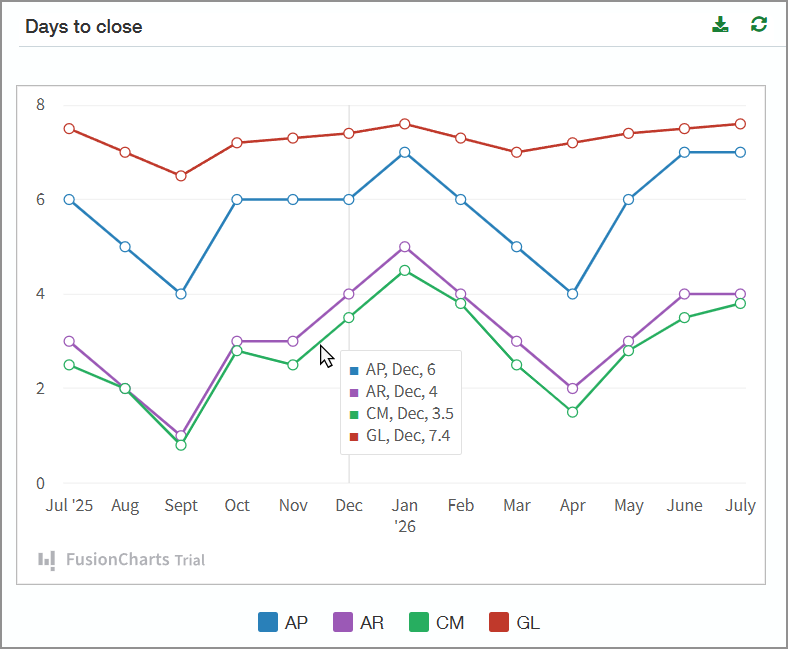
Days to close
The Days to close section shows the number of days required to close your applications for the period selected in the Filters section. Point to a segment on one of the graph lines to view the days to close each application for the month represented in that segment. A small window opens and shows the average days to close each application.
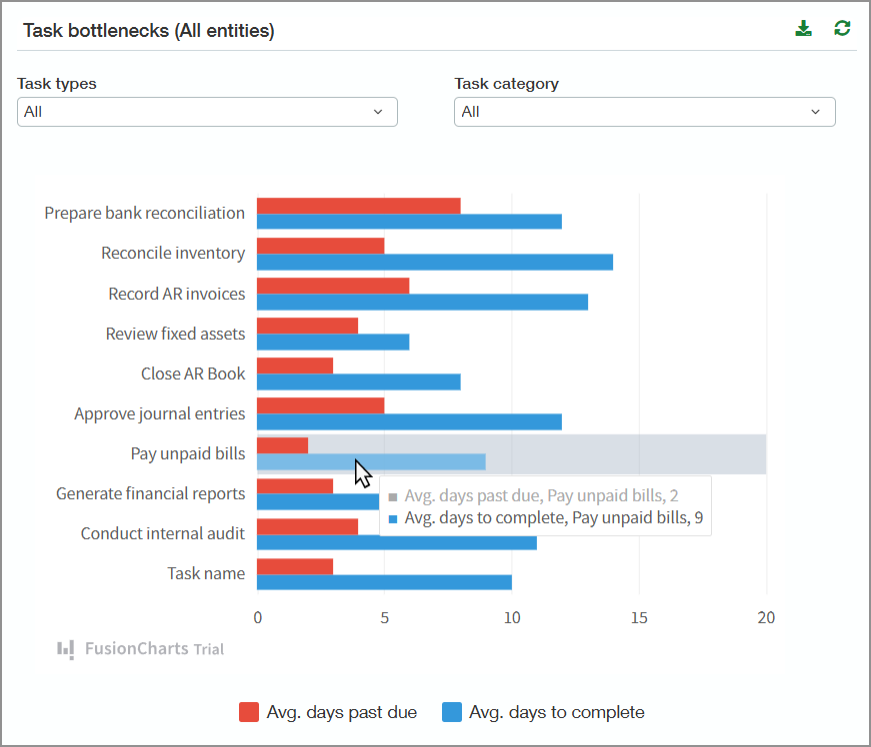
Task bottlenecks
The bar graph in this section lists the tasks included in the selected checklist template. The graph shows the average number of days that tasks go past due and the average number of days to complete them.
Point to any bar in the graph to view the exact number of days. You can filter the chart by the task type or category.
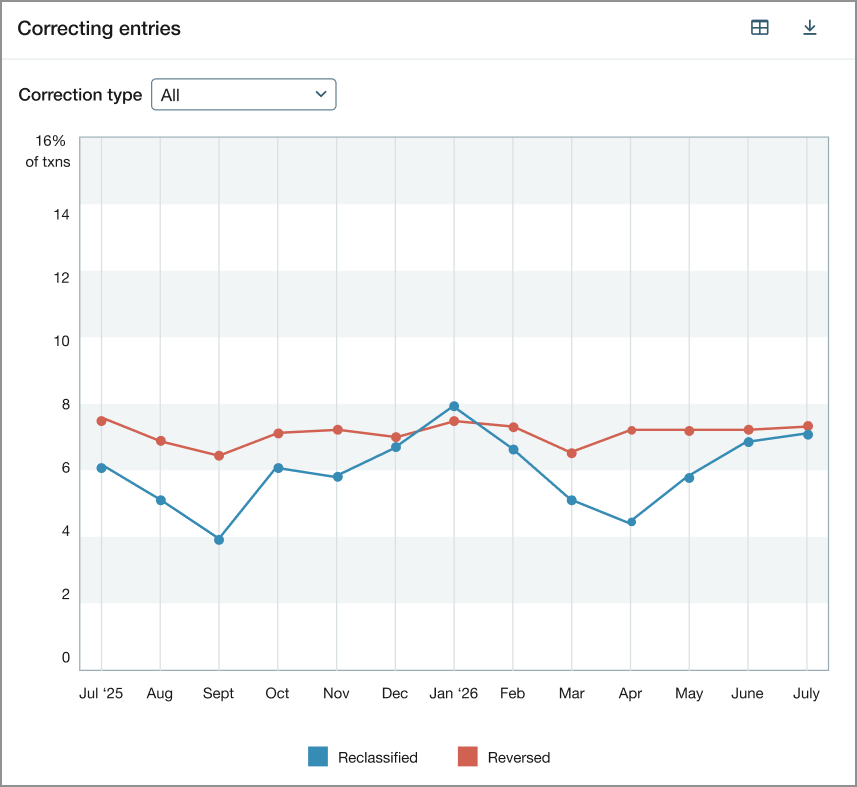
Correcting entries
In the Correcting entries graph, you can see trends in reclassification and reversing transactions by month. The values plotted in the graph reflect the percentage of transactions that were reclassified or reversed.
You can show both types of correcting entries or filter to show one or the other. Select a point on the graph to view the following details:
-
Number of transactions for the month
-
Number of transactions that were reclassified
-
Number of transactions that were reversed
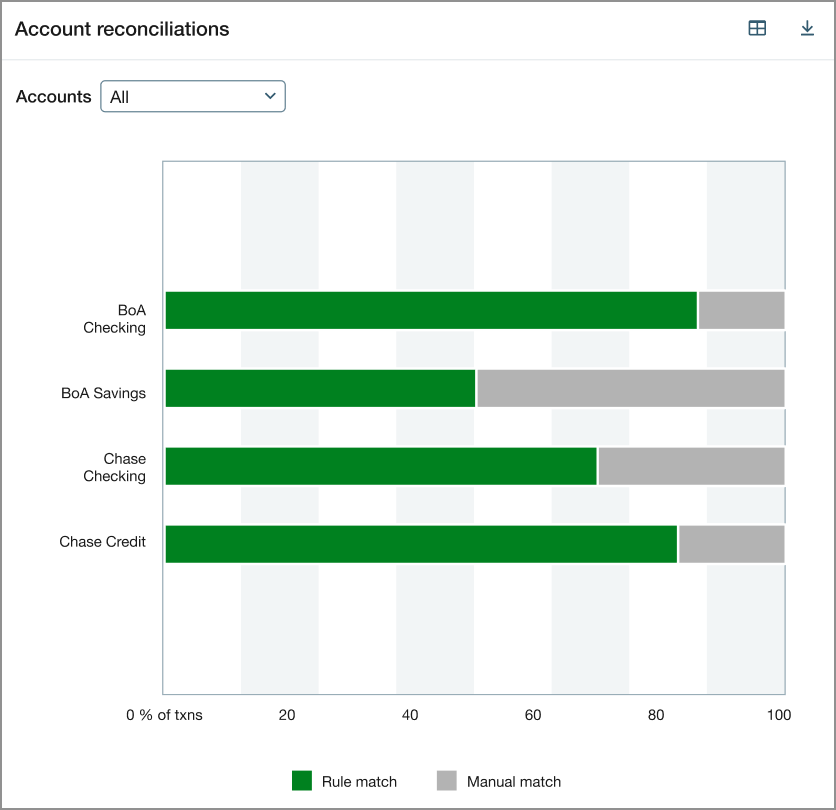
Account reconciliations
The account reconciliations graph lists all your active checking and savings accounts. For each account, the graph shows the percentage of transactions that were automatically matched based on matching rules and the percentage that were matched manually.
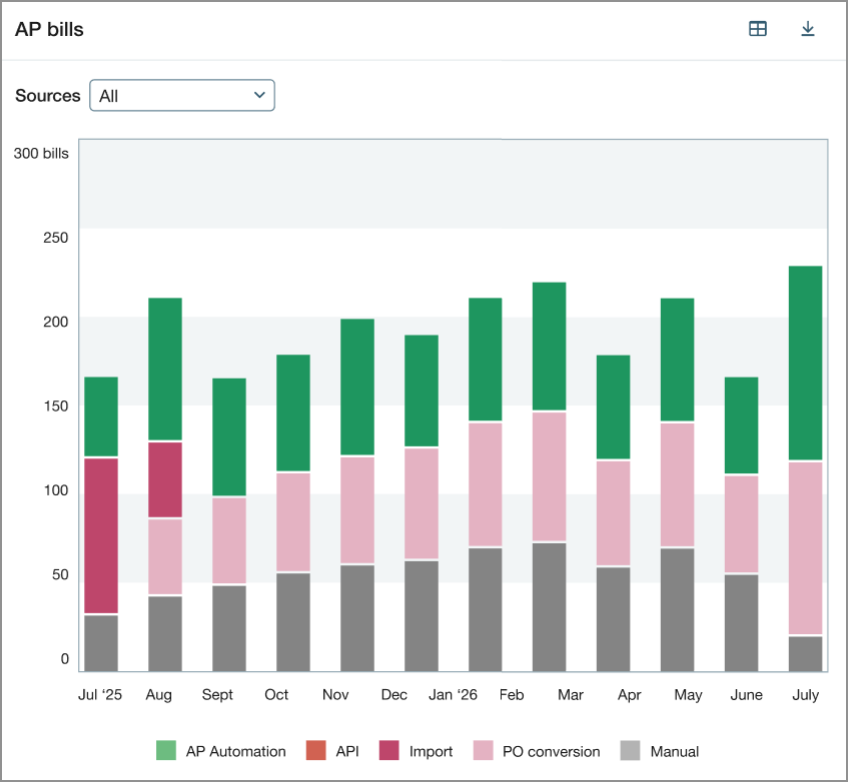
AP bills
The AP bills graph indicates how bills were entered into Intacct each month, for example, through AP automation, PO conversion, or manual entry. Select a bar in the graph to view the values for each bill entry source.
About the Early Adopter program
Close analytics is available for participants in the Close Automation Early Adopter program. New registration for the Close Automation Early Adopter program is closed.
Permissions and other requirements
| Subscription |
Close Automation |
|---|---|
| Regional availability |
|
| User type |
Business |
| Permissions |
Close Automation Close analytics: Run |