IVE visualization shows two different displays
If you generate an Interactive Visual Explorer (IVE) visualization, and then Edit the same visualization, two different views might display. This topic explains why this happens, and how you can easily fix it.
Problem
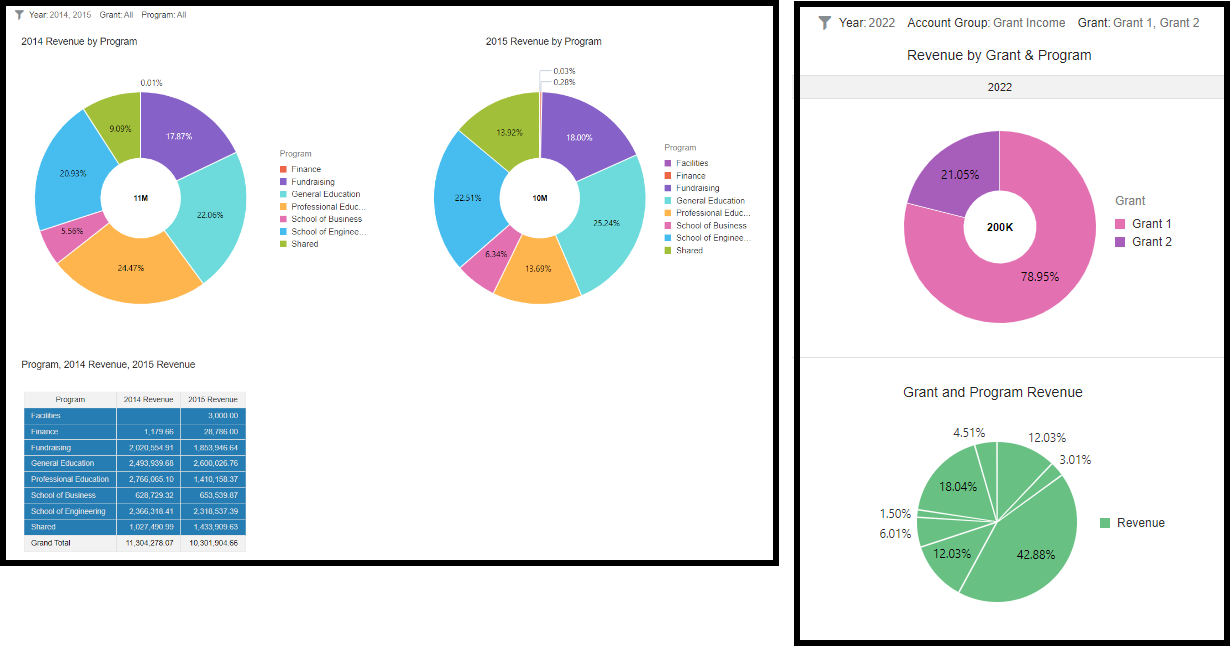
An IVE visualization was created as a copy of another IVE visualization. The copied visualization was then edited. The original visualization is shown on the left and the edited version of the copied visualization is on the right. When the edited visualization was generated, it was expected that it would reflect the new modifications (as the image on the right). Instead the original display (on the left) appeared.

Diagnosis
IVE provides the ability to tell a story about the data with the Narrate feature. For example, you might create a presentation that starts with high-level financial results, followed by pages with greater detail, or data breakdowns.
The Narrative comprises a series of canvases. However, one or more Narrative pages are what you see when you generate the canvas to tell the story. The narrative views are not necessarily configured to look like a particular canvas. Instead, a narrative page can include multiple visualizations from a variety of canvases. You can have multiple narrative pages that progress page-to-page to tell a story.
That's what happened to show two different displays. The narrative page was created in the original (source) canvas. When that canvas was copied to create a new canvas, the narrative page was included.
One or more narrative pages are the default way of viewing the data while generating the canvas. So, the old narrative page for the original canvas and its visualizations was the default presentation page for the new report.
Solution
You can easily change the Narrative view for a canvas.
-
Go to the newly modified IVE canvas.
-
Select the Narrative link on the main toolbar.
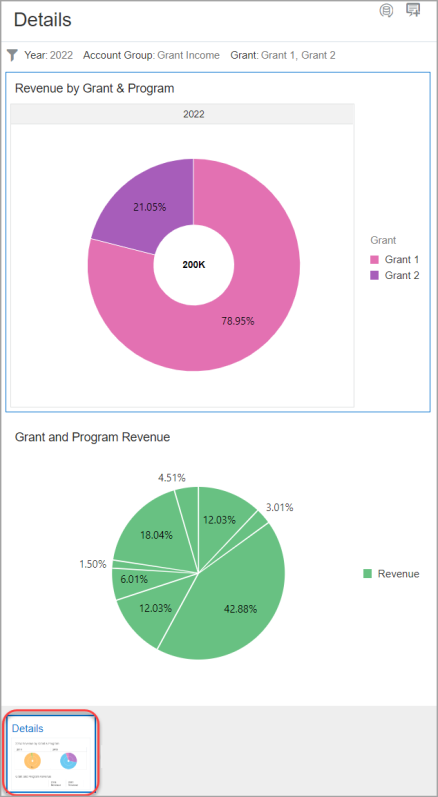
IVE updates the Narrative view to match the report. Look below the visualizations in the lower left. A small preview window in the lower left corner updates to show the expected view for the visualization. -
Save the canvas and generate it to display the updated narrative vie
In the following image, the current Narrative view does not display the newly edited canvas visualizations. However, a spinner icon appears to indicate the display is being updated.

