Dimension analysis in financial reports
Related information
In addition to generating standard reports, such as Profit and Loss reports, you can use financial reporting to analyze or highlight key business metrics in the rows or columns of financial reports. For instance, instead of just reporting on revenue and expenses, why not take the next step and analyze your revenue by product line, get a list of the most profitable customers, or look at a breakdown of expenses by project?
To give you the most reporting flexibility, we let you choose:
- How you want to analyze and represent your dimension data on reports.
- Whether you want to highlight the data on the rows or columns of your report.
To create a new financial report:
-
Go to Reports > All > Core and select Add (circle) next to Financial reports.
Represent dimensions on financial reports
You're already gathering the raw material you need for reporting analysis, just by using Intacct. You're probably tracking data by dimensions such as department, location, customer, vendor, project, or item. But, how do you harness that data so you can go from ordinary "ho hum" reports to extraordinary reports that highlight key business metrics?
Dimension reporting structures are structures that represent dimensional data that you intend to use on the rows or columns of financial reports
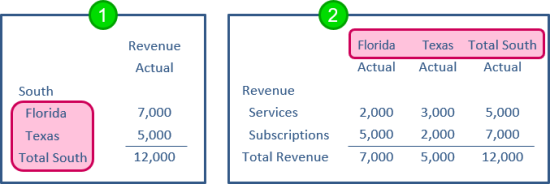
- Dimension structure on reports rows.
- Dimension structure on report columns.
For example, you might create report structures that show:
- Selected departments
- Customers by type
- Items by product line
You can create any number of dimension report structures to represent the different ways you want to segment your data. For instance, you might create multiple Customer structures that enable you to analyze your "Customers by type," "Customers by sales territory," and so on.
After they're created, the re-usable report structures can be used across the rows or columns of any number of financial reports.
Learn more about dimension report structures.
Create reports that display dimensions across rows or columns
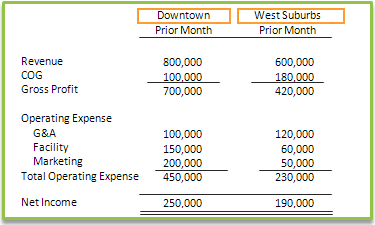
When you create a new financial report, you can choose what you want to see along the left side of your report.
- When you select "accounts" on rows, you have the option to enhance a traditional financial report with dimension data, such as taking a Profit and Loss report and comparing by product line across columns.
- When you select "dimensions" on rows, you can create a report that features selected dimension data (such as customers or projects) in report rows, instead of the traditional list of account groups and accounts.
To create a report that features dimensions in report rows or columns:
- Create a new financial report: Go to Reports > All > Core and select Add (circle) next to Financial reports.
- Give your report a name on the Report info tab.
- In the Report structure section of the Report info tab, select the type of report to create.
- As you select options, sample reports demonstrate the type of report output you can generate.
- When you find a sample that's similar to what you're trying to do, select Show me how to create this type of report to get step-by-step instructions.
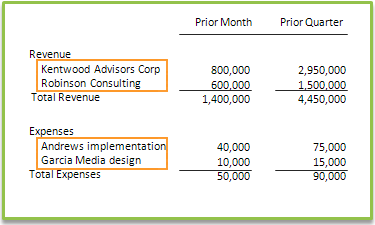
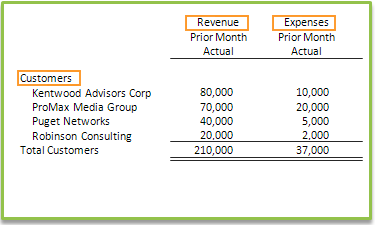
Sample reports with step-by-step instructions
The Report Info tab of the Financial Report Writer displays samples of some of the types of reports you can generate. Select the corresponding help topic to get step-by-step instructions, with tips on creating some common variations.
| Report structure | Steps to create |
|---|---|
|
|
Revenue report, filtered by location on columns |
|
|
Revenue by customer and expenses by project |
|
|
Customers on rows, with revenue and expenses on columns |
|
|
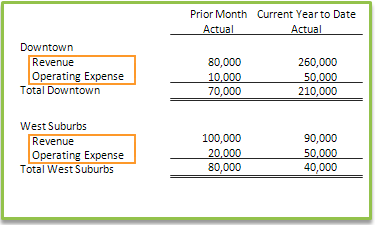
Locations filtered by account group |
What if I have records with no dimensions?
When you build the structure to select into the rows (from groups) you can define what happens. If you expand by dimension on an account that has no dimensions, the report shows you a ‘no value’ amount after listing records with a value. You can select one of the following in the Show field to include entries that are not coded to a dimension:
- One level down, with roll up
- All levels, with roll up
Troubleshoot report display
If the column names for dimensions do not appear correctly in your reports, remove the -crw.intacct.com cookies from your browser.
Need more help?
There is plenty of training available for reports. Sage Intacct offers training courses to help you understand reporting. Check Sage University for details about pricing and availability.
Be sure to check out the Intacct Community and search the Knowledge Base for specific issues. Often you'll find the answers there.
If you have questions or encounter particular issues, be sure to check out our troubleshooting topics.