MEA Allocations report—Order Entry
The MEA Allocations report shows pricing data on sales of items that are part of a multi-element arrangement. Use this report to identify how the system allocated revenue for sales that are part of a multi-element arrangement based on one or more of the following methods:
- VSOE (Vendor-Specific Objective Evidence)
- TPE (Third-Party Evidence)
- ESP (Estimated Selling Price)
Who typically needs this report?
- Financial executives who need to determine how the system allocated revenue for items sold under a multi-element arrangement
- Revenue managers who need to review allocations to verify revenue allocations
- Finance personnel who need to provide auditors with details on how revenue allocations were allocated for any given transaction
To access this report, go to Order Entry > All > Reports and select MEA allocations.
| Subscription |
Order Entry and Advanced Revenue Management |
|---|---|
| User type |
Business |
| Permissions |
MEA Allocation: View |
| Configuration | Enable MEA Allocations = true |
View a monthly report
- Generate the report.
-
On the report settings page, select View.
A report showing results for the default reporting period appears in your browser.
- Optionally, to refine the report, select Customize.
Customize and run
Before running the report, you can select the time period what you want included in the report. You can also specify how you want the report to appear.
If you don't select any data entry boxes or specify any search options, the report may take a long time to run and return results that's too large to be useful.
-
Select the reporting period from the dropdown menu, or enter the desired start and end dates. If you don't specify a reporting period, the system generates a report for the current month to date.
You can specify either the reporting period or the start and end dates, but not both.
-
Set the filters for the desired data results.
Filters allow you to include or exclude specific types of data in the report. In general, it is recommended to set filters to achieve to get fewer and more precise results.
-
Format the report.
Options vary from report to report. Generally, you can set the report layout and arrange how to group and display the data.
- Type a title, subtitle, and footer text for your report.
-
To view, process, memorize, export, or customize the report or add it to the dashboard, select one of the following options:
- View: View the report now, in your browser.
- Print: Display the report now, in printable PDF format.
- Process & store: Generate the report and store it for later access. Reports can be either stored in the My Stored Reports list or delivered to a cloud storage location, such as Dropbox. Learn more about processing and storing reports.
- Add to dashboard: Add the report to your dashboard.
-
Memorize: Memorize (that is, save) the report so that later you can refer back to it or modify and re-run it.
You can schedule memorized reports to run on a recurring basis. Intacct can automatically email the reports or deliver them to a cloud storage location.
- Export: Export the report to a separate file that you can then distribute or save to your local drive. File formats to which you can export the report data vary among reports.
- Customize: After you run the report, return to the main report page and refine the report further.
- Email: After you run the report, email to others.
Some options are only available if you access the report from the Reports center.
Time period
You can use one of the numerous pre-defined reporting periods available from the Reporting period and As of date fields, or create your own reporting period using the Start date and End date fields.
In the Time period section, do one of the following:
- Use the Reporting period dropdown list to select the reporting period. Either enter a date in the As of date field or use the calendar tool to select a date.
- Enter a specific Start date, End date, or both. Alternatively, use the calendar tool to select the desired dates.
If you complete all the time period fields (that is, if you fill in the Reporting period, As of date, Start date, and End date fields), Intacct generates your report based on the start and end dates. It ignores the As of date.
The following table describes the fields in the Time period section.
| Field | Description |
|---|---|
|
Reporting period |
These periods are relative to the As of date. All periods begin on the first day of the period, such as the first day of the month, quarter, or year that you select. |
|
As of date |
The date that Intacct will use as a baseline for the reporting period you select. Defaults to today's date. |
|
Start date |
Leave the Start date blank to include all information from the earliest date of your Intacct data up to and including the end date. |
|
End date |
Leave the End date blank to include all information from the start date up to today. |
|
Prompt on run |
Select this checkbox to force Intacct to wait for you (or anyone using this report) to enter a location, department, and/or time period before it will run the report. |
Report filters
Use the filters to focus the results of your report. In effect, filters enable you to isolate and assemble just the data you want. You can set any combination of filters.
All From and To field pairs work the same way. Use them to get search results in as broad or as fine a range as you need, from everything in the system down to a single specific object.
To run this report for a single object:
- From the From dropdown list, select the object you want.
- From the To dropdown list, select the same object.
To run this report for a specific range of objects:
- From the From dropdown list, select the object that you want at the beginning of the range.
- From the To dropdown list, select the object that you want at the end of the range.
To run this report for all objects:
Leave both fields blank.
If you have a large number of objects or the report takes too long to process, use the From and To fields to run a series of smaller reports. For example, you can run five reports, one each for objects whose names begin with A-E, then F-J, K-O, P-T, and U-Z.
An object is a catch-all term that refers to any specific data item in the system. Customers, vendors, items, and accounts are all examples of objects.
- To limit the report to a specific fair value price list, select the list from the Fair value price list dropdown list.
- If your company uses multiple currencies, to limit the report to a particular currency, select Transaction currency, then select the appropriate transaction.
- To limit the report to show results for a specific customer or range of customers, use the From customer and To customer dropdown lists.
- To limit the report to show results for a specific item or range of items, use the From item and To item dropdown lists.
- To limit the report to show results for a specific transaction type, select Transaction type, then select the type you want.
The following table describes each item in the Filters section of this report settings page:
| Filter field | Notes | Limitations |
|---|---|---|
|
Fair value price list |
Limits the report to a specific price list. |
|
|
Transaction currency |
Limits the report to a specific currency. |
Multi-currency company only |
|
From customer, To customer |
Filters for a customer or range of customers by customer name or number. |
|
|
From item, To item |
Filters for a range of items by item name or number, for example, items from A to F, or item numbers 3100 to 5000. |
|
|
Transaction type |
Limits the report to a specific type of transaction, such as Sales Quote, Sales Order, and so on. |
Formatting
| Format field | Notes |
|---|---|
|
Include subtotals |
Allows the system to display subtotals of grouped items. |
|
Include delivered items |
Select to include delivered items in the report. |
|
Include undelivered items |
Select to include undelivered items in the report. |
Location and department filters
-
To filter the report by geographic location, select the location from the Location dropdown list.
Enter or select a location to run this report at the top level. Intacct uses the location that you specify to determine the appropriate currency.
- To filter the report by department, select the department from the Department dropdown list.
-
If you want the report to cover certain locations regardless of what you select in the Location dropdown list, in the Show for dropdown list select one of the following:
- All Locations: Include data for all locations regardless of the entity you're currently using.
- This Location: Include data only for the entity that you're currently using.
-
Child Locations: Include data only for the locations that are child locations of your current entity.
For example, if your current entity is California, and you have child locations for San Francisco and Los Angeles, use this option to have the report include data only for Los Angeles and California.
| Filter field | Descriptions |
|---|---|
|
Location |
Use to limit report results to a specific location. |
|
Department |
Use to limit report results to a specific department. |
|
Prompt on run |
Select this checkbox to force Intacct to wait for you (or anyone using this report) to enter a location or department before it runs the report. |
|
Show for |
Select to show different views of the data, based on the location or entity you choose: All locations: This option shows the data that's posted to the location or entity and its children. This location: This option shows only the data that's posted to the location or entity you select. The data posted to any child location is not shown. Child locations: This option shows only the data that's posted to the child locations of the location or entity that you select. Any data that's posted to the parent location or entity is not shown. Example: Suppose your location is United States > California > San Francisco. All locations would show transactions for United States, California, and San Francisco. This location would show transactions for United States. Child locations would show transactions for California and San Francisco only. |
Titles and footer
Titles, subtitles, and footers apply only to the print versions of this report. Export to Excel or CSV, or select Print for a PDF version.
-
Enter the title in the Report title 1 field.
- This title displays in large type at the top of the page, directly under your company name.
- You can type over any default name that Sage Intacct might have populated in this field.
-
Enter the subtitle in the Report title 2 field.
- The subtitle displays in smaller type, directly beneath the main title.
- Enter the footer text in the Footer text field. Footer text displays at the bottom center of the report.
You can use up to 80 characters, including spaces, in each title, subtitle, and footer.
Column descriptions
The following table describes each item in the MEA Allocations report:
| Column | Description |
|---|---|
|
Document date |
The sales transaction date. |
|
Customer |
The customer to which the sales transaction applies. |
|
Document ID |
The sales transaction identifier. |
|
Currency |
The transaction currency |
|
Price list name |
The name of the fair value price list used by the transaction. |
|
Item |
The item ID for which the fair value is being allocated. Items in kits for which revenue is recognized at the kit level will display as one item (the kit item). Items in kits for which revenue is recognized at the component level will display separately (each component item will be listed). |
|
Status |
Indicates whether the item is Delivered or Undelivered. Learn more about delivery status. |
|
Fair value price |
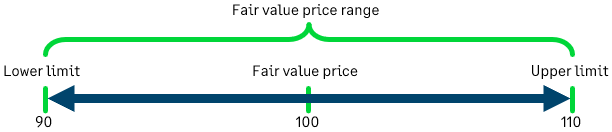
If this item is not using fair value price ranges, this field displays the fair value price for the item from the fair value price list selected on the sales transaction. The fair value price can be an amount or a percent. If this item is using fair value price ranges, this field displays one of the following: the transaction price, the fair value price, the lower limit price, or the upper limit price. For example, assume that in the fair value price range, the lower limit price is 90, the fair value price is 100, and the upper limit price is 110.
|
|
Extended fair value price |
If the Fair value price = an amount, this field equals the fair value price multiplied by the quantity for the corresponding item. If the Fair value price = percent, this field equals the fair value price (percentage) multiplied by the sum of either the fair value prices, sales transaction prices, or base prices associated with all items in the arrangement that are in the fair value category(ies) associated with this item's fair value price. |
|
Txn price |
The extended selling price of the item on the sales transaction. |
|
MEA allocation (txn) |
The allocated revenue for the corresponding item expressed in the transaction currency. See How multiple-element arrangement revenue is allocated to see the calculation breakdown for this field. |
|
MEA Allocation (base) |
The allocated revenue for the corresponding item expressed in the base currency. See How multiple-element arrangement revenue is allocated to see the calculation breakdown for this field. Select the link in this column to display the Revenue Recognition Schedule for the corresponding line item. |
|
Reallocated? |
Indicates whether or not the revenue was reallocated for the corresponding item. The Reallocated? value will be the same for all items in a particular bundle (MEA). |