Use Copilot Variance Analysis
Related information
Copilot Variance Analysis alerts budget owners and finance leaders whenever actual spending exceeds your budget. Copilot notifications are designed to keep budget owners in the loop, whether it’s a timely update or an on-demand review. You can drill into report insights to see exactly how your budget is doing, including detailed breakdowns and visualizations.
| Subscription |
Copilot Variance Analysis |
|---|---|
| Regional availability |
|
| User type |
Business Employee Project Manager |
| Permissions |
Sage Copilot Close Automation
General Ledger
|
Example of using Copilot Variance Analysis
You interact with Copilot using suggested prompts, which are predefined queries. You can use the available suggested prompts in any order when exploring budget variances.
The following is an example of a variance analysis exploration. The suggested prompt names and the data you actually see depend on your company's environment and your data access.
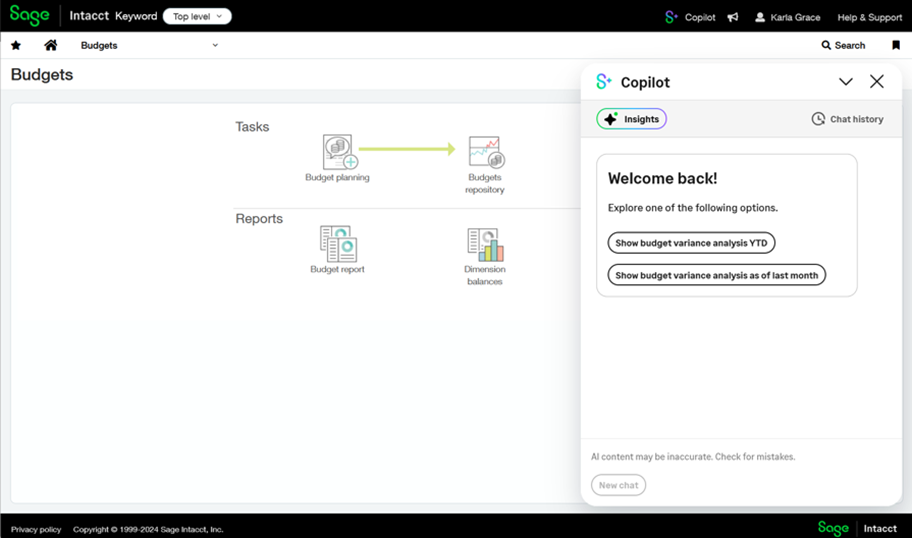
- On any page in Sage Intacct, select the Copilot icon in the top, black title bar.
The Copilot panel opens on the right side of your browser window on top of the current Intacct page.
-
Let's say today is October 29, so you select Show budget variance analysis YTD. If today was November 1, you might select to Show budget variance analysis YTD as of last month instead.
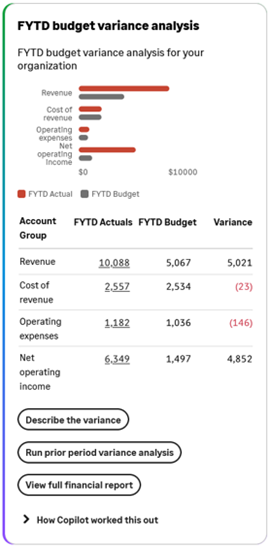
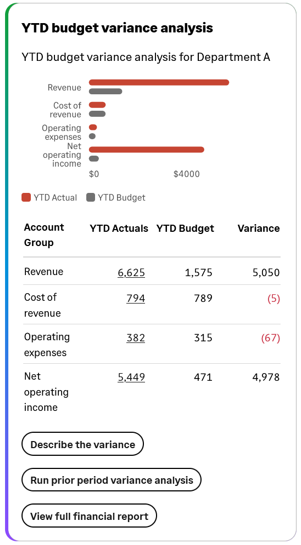
The Copilot chat pane displays the YTD budget variance analysis insight card, which shows a chart visualization and budget vs. actual details for the Revenue, Cost of revenue, Operating expenses, and Net operating income account groups.

-
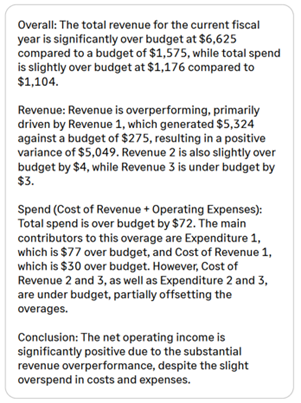
Select Describe the variance.
Copilot generates a description of the variance based on the analysis of account groups and GL accounts.
-
You see that the Expenditure 1 GL account is the main contributor to over budget expenses, so you scroll up to the visualization and select the Operating expenses value in the YTD Actuals column to investigate further.
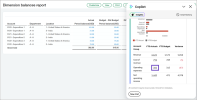
Copilot opens the Dimension balances report filtered to show the GL accounts within the Operating expenses account group. From here, you can drill-down further to the General Ledger report to see specific transactions contributing to the variance or drill-down into the Budget report to view the budget breakdown.
-
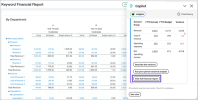
You now want to see all financial details, so you select View full financial report in Copilot.
Copilot opens the financial report specified in the Variance Analysis configuration. From here, you can drill-down to investigate further as desired.

Understand your variance analysis data
When reviewing variance analysis data, you need to consider the following concepts: the specific timeframe being analyzed, the timing of insight generation, and the scope of your data access.
Timeframe and presentation variations
Copilot may show variance analysis data in the following contexts:
- Year to date (YTD): This refers to the period from the beginning of the calendar year (January 1) to the current date. If your company's fiscal year starts on January 1, you will see suggested prompts to run the variance analysis for YTD.
- Fiscal year to date (FYTD): This refers to the period from the beginning of your company's fiscal year to the current date. If your company's fiscal year does not start on January 1, you will see suggested prompts to run the variance analysis for FYTD.
- Budget data presentation differences:
- Financial reports: Present budget data that is prorated according to the number of days in the month being evaluated.
- Copilot insights and the Dimension Balances report: Present the budget amount for the full budget period—it is not prorated.
When insights are generated
An insight is a piece of information, suggestion, notification, or report that Copilot believes may be valuable to a user. Copilot generates insights as follows:
- Pre-generated insights—Copilot generates these insights via an overnight process that runs at the configured frequency, which can be daily, weekly, or at the end of the month. The process starts at midnight relative to your company's configured timezone. When an insight is generated, Copilot notifies the applicable users that an insight exists via a notification badge in Sage Intacct and optionally via an email.
For example, say that your environment is configured to send notifications weekly and today is Thursday, October 17. You receive an insight notification and then display the related insight in Copilot. The insight card's timestamp shows that the insight was created after 12:00 AM on Monday, October 14.
- Real-time insights—Copilot generates these insights when you select an applicable suggested prompt. For example, if you select Run prior period variance analysis, Copilot generates that insight when you select the prompt. The run As of date may depend on whether the GL books are open or closed.
If you're not sure if you're looking at a pre-generated or real-time insight, check the timestamp at the bottom of the insight card.
Data access scope
The data you see is based on your business unit or unrestricted user assignment and also by whether you're accessing Copilot from the entity or top level:
- If you're a budget manager, you'll see data for one or more business units to which you're assigned as manager. For example, say you're assigned as the manager of Department A. You'll see variance analysis data for Department A.
- If you're assigned as an unrestricted user, you'll see data for the entire organization.
Not seeing the right data? Ask your Sage Intacct Administrator to verify your notification source assignment and permissions.
Variance analysis insights
Note the following about variance analysis insights:
- Business unit managers will see data applicable to each assigned department, location, or entity record. If a manager is assigned to more than one dimension record, a Show next prompt appears in each insight card. Use the Show next prompt to display the insight card for each applicable dimension.
- Unrestricted users will see data for the entire organization.
- Insight data may also be relative to whether you're accessing Copilot from the top level or the entity level.
The following table describes the different variance analysis insights.
| Insight title | Example | Description | How to display it |
|---|---|---|---|
| <YTD or FYTD> budget variance analysis |
|
Shows current YTD or current FYTD actual and budget amounts for the configured Revenue, Cost of revenue, Operating expenses, and Net operating income account groups. |
Do one of the following:
|
| <YTD or FYTD> budget variance analysis as of last month | 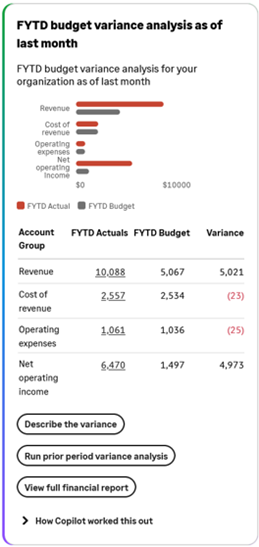
|
Shows the current YTD or FYTD actual and budget amounts for the configured Revenue, Cost of revenue, Operating expenses, and Net operating income account groups as of last month based on the following:
|
Select Show budget variance analysis as of last month from a new chat. |
| Prior period variance analysis | 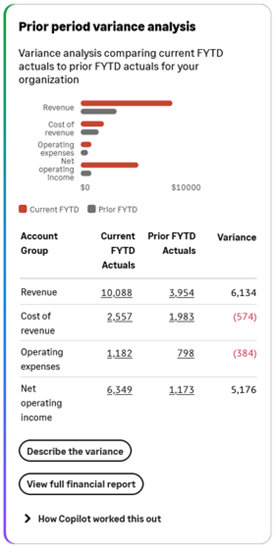
|
Shows current YTD or FYTD actuals compared to prior YTD or FYTD actuals for the configured Revenue, Cost of revenue, Operating expenses, and Net operating income account groups. |
Do one of the following:
|
| Prior period variance analysis as of last month | 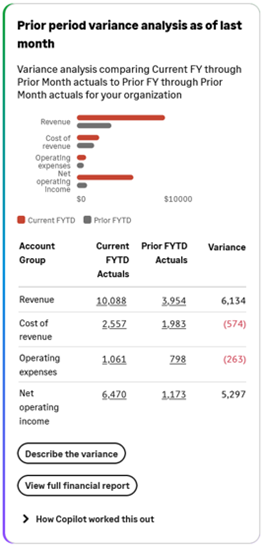
|
Shows current year or fiscal year through prior month actuals compared to prior year or fiscal year through prior month actuals for the configured Revenue, Cost of revenue, Operating expenses, and Net operating income account groups. | Select Run prior period variance analysis from the <YTD or FYTD> budget variance analysis as of last month insight card |
| <Departments or Locations> have exceeded budget |
|
If the scheduled notification process finds that the Operating expenses account group total exceeds the budget total, Copilot generates this insight. Business unit managers will see all account group details for the applicable departments or locations. Unrestricted users will see only the Operating expense totals for each applicable department or location. |
If this insight notification was generated, select the View more link from the insight notification |
|
Displays an AI-generated description of the variance analysis based on the evaluation of the account groups and associated GL accounts. | Select Describe the variance from an insight card. | |
| Financial report | 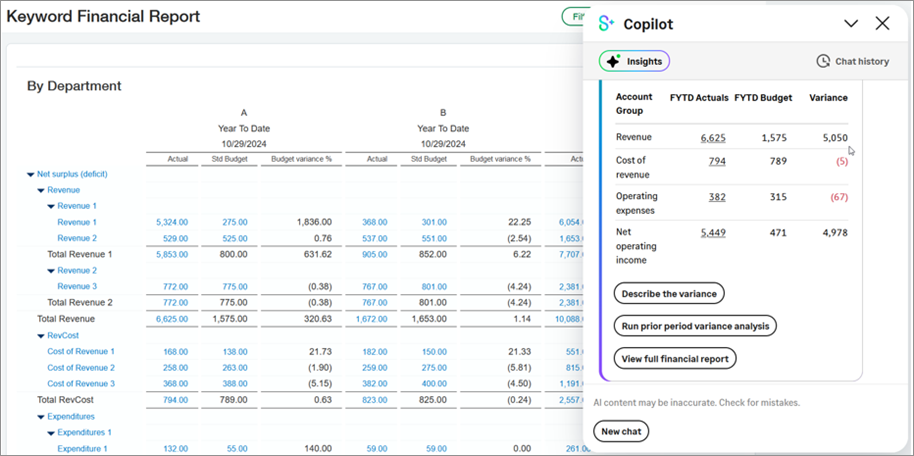
|
Displays the financial report specified in the Copilot variance analysis configuration. Use this report to investigate details on a reported variance. Note the following expected behavior when launching a financial report from Copilot:
|
Select View full financial report from an insight card. |
| Dimension balances report | 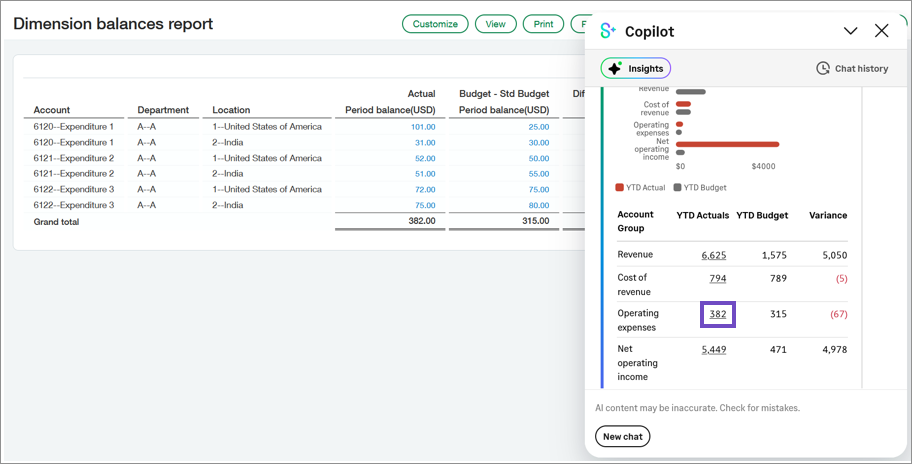
|
From an insight card, you can drill into the Dimension balances report for each applicable account group. The Dimension balances report is filtered to match the selected value. For example, say that you are showing the YTD budget variance analysis for Department A. If you select the Actual value next to the Revenue account group, the Dimension balances report is filtered to show only GL accounts within the Revenue account group hierarchy that are tagged to Department A. From the Dimension balances report, you can then drill into the General Ledger report or Budget report for the applicable values. |
Select an actual value in an insight card. |