Explore reporting solutions
Sage Intacct offers a suite of reporting solutions that you can use to meet your business needs.
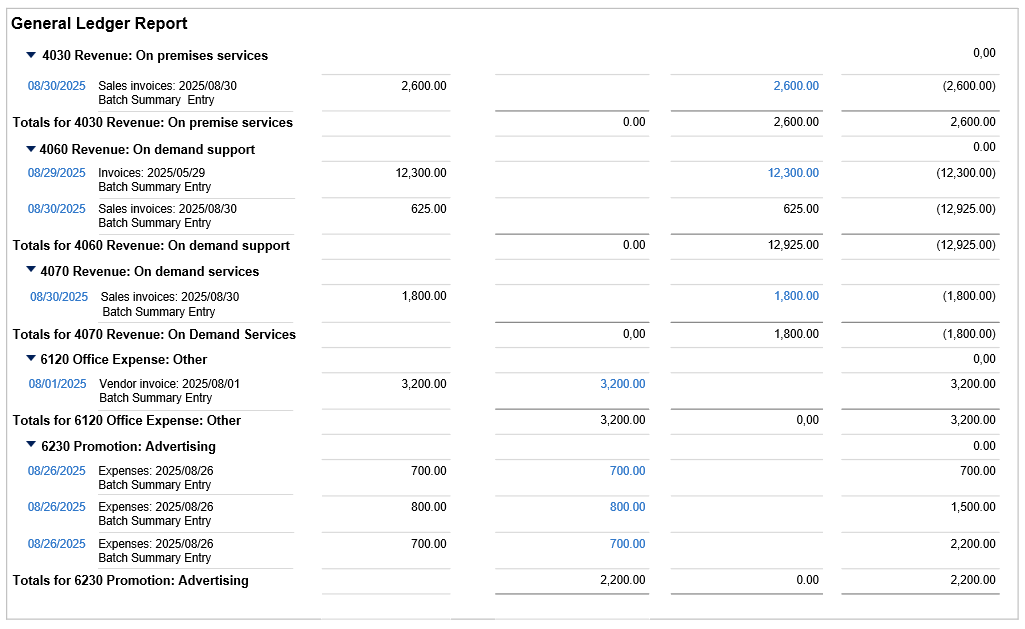
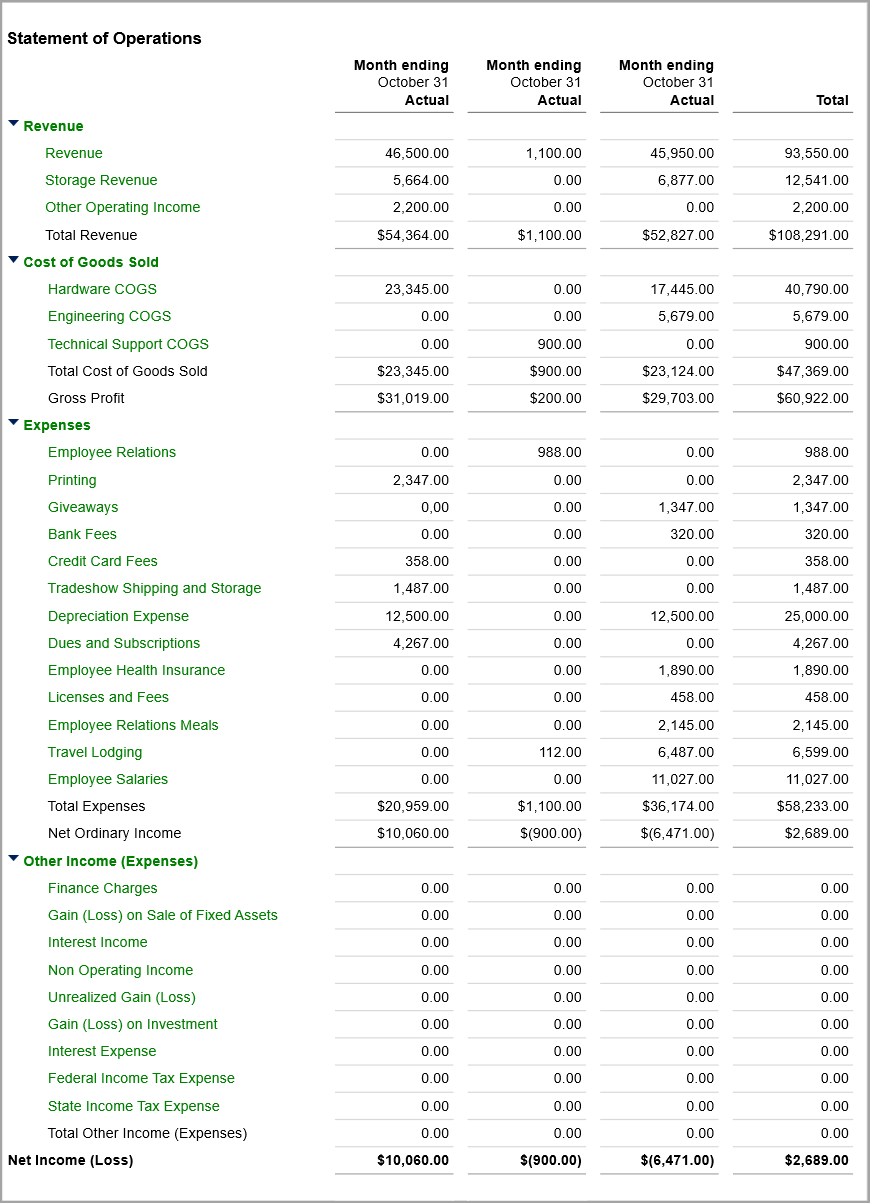
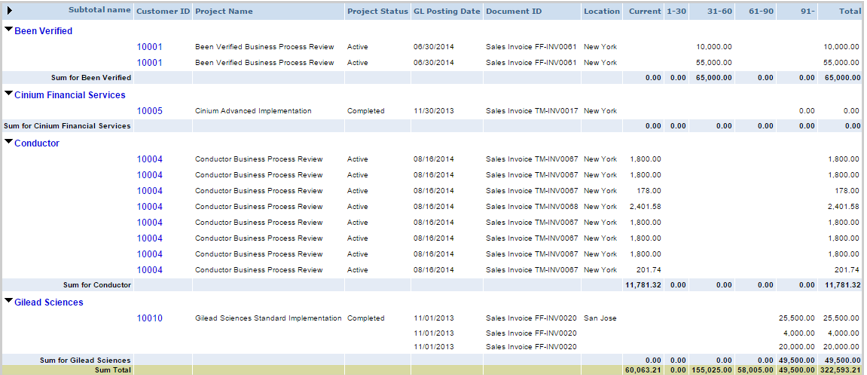
Select a thumbnail Example in the following table to view the full-size report.
| Reporting solution | Example |
|---|---|
|
Standard application reports
For more information, see About standard application reports. |
General Ledger standard report |
|
Financial reports
For more information, see Financial reports. |
Financial Statement of Operations |
|
Custom Report Writer (CRW)
For more information, see Welcome to Custom Report Writer |
Customer line-aging report |
|
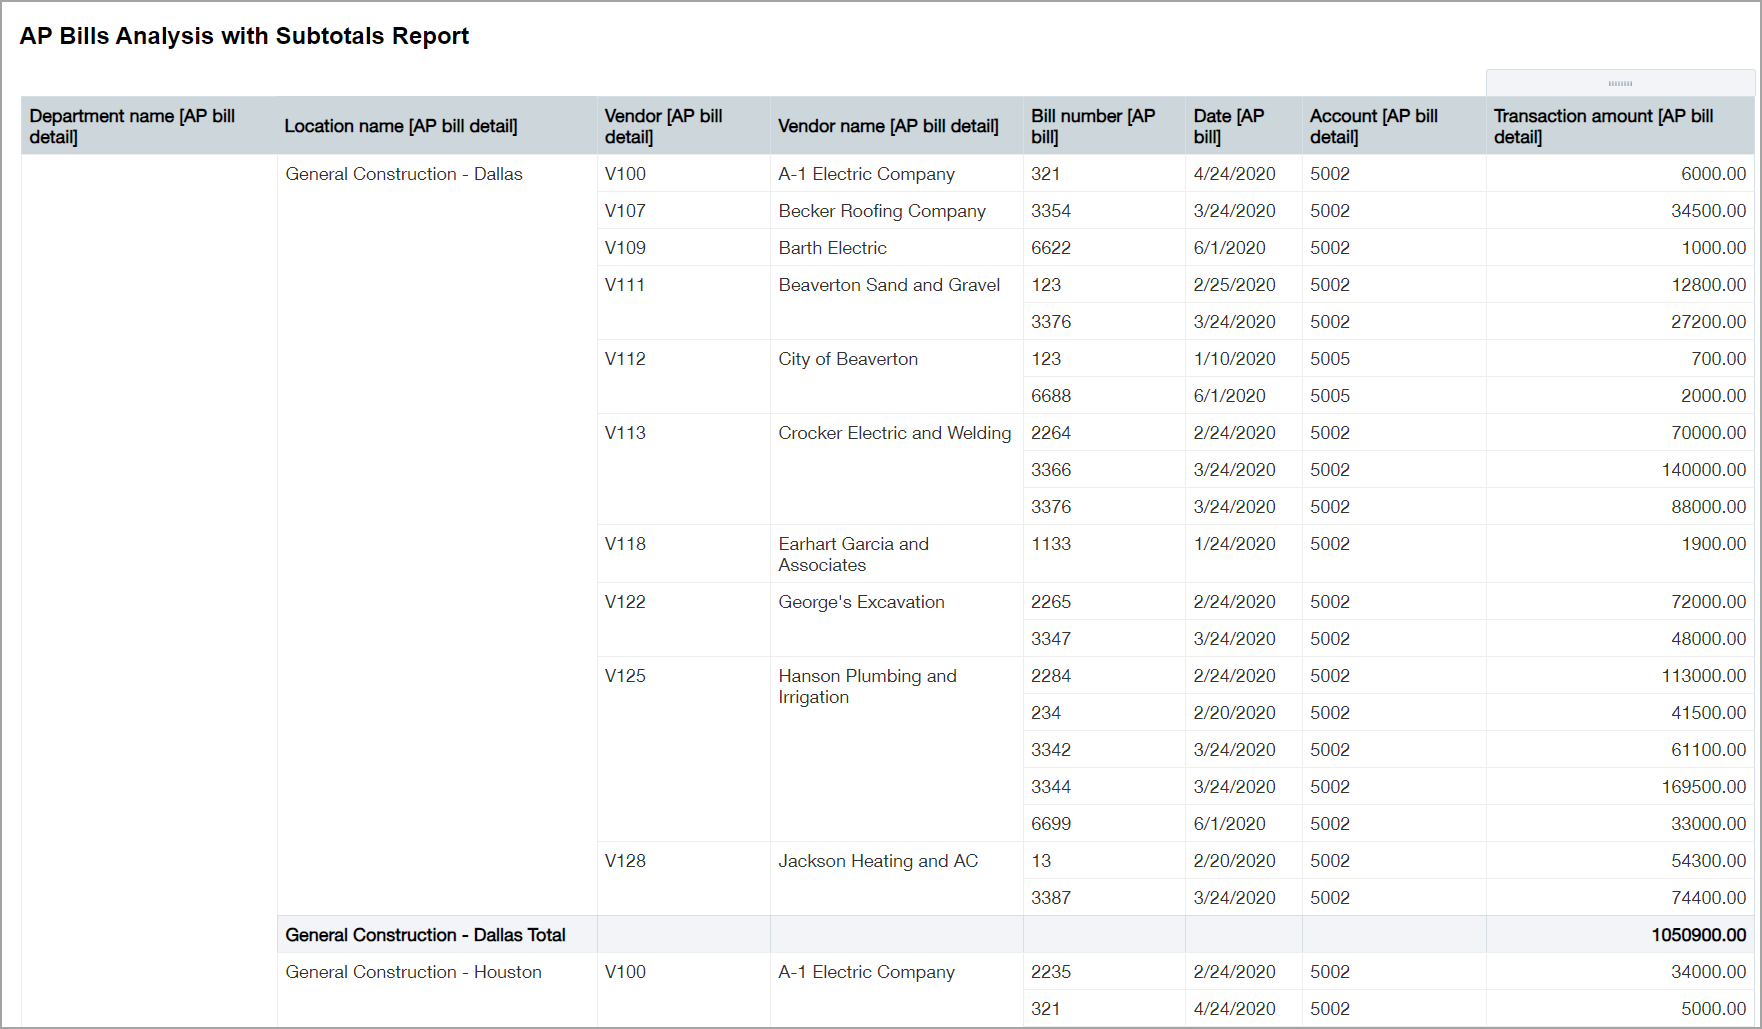
Interactive Custom Report Writer (ICRW)
For more information, see Introduction to ICRW video and ICRW learning journey. |
AP Bills Analysis with Subtotals report |
|
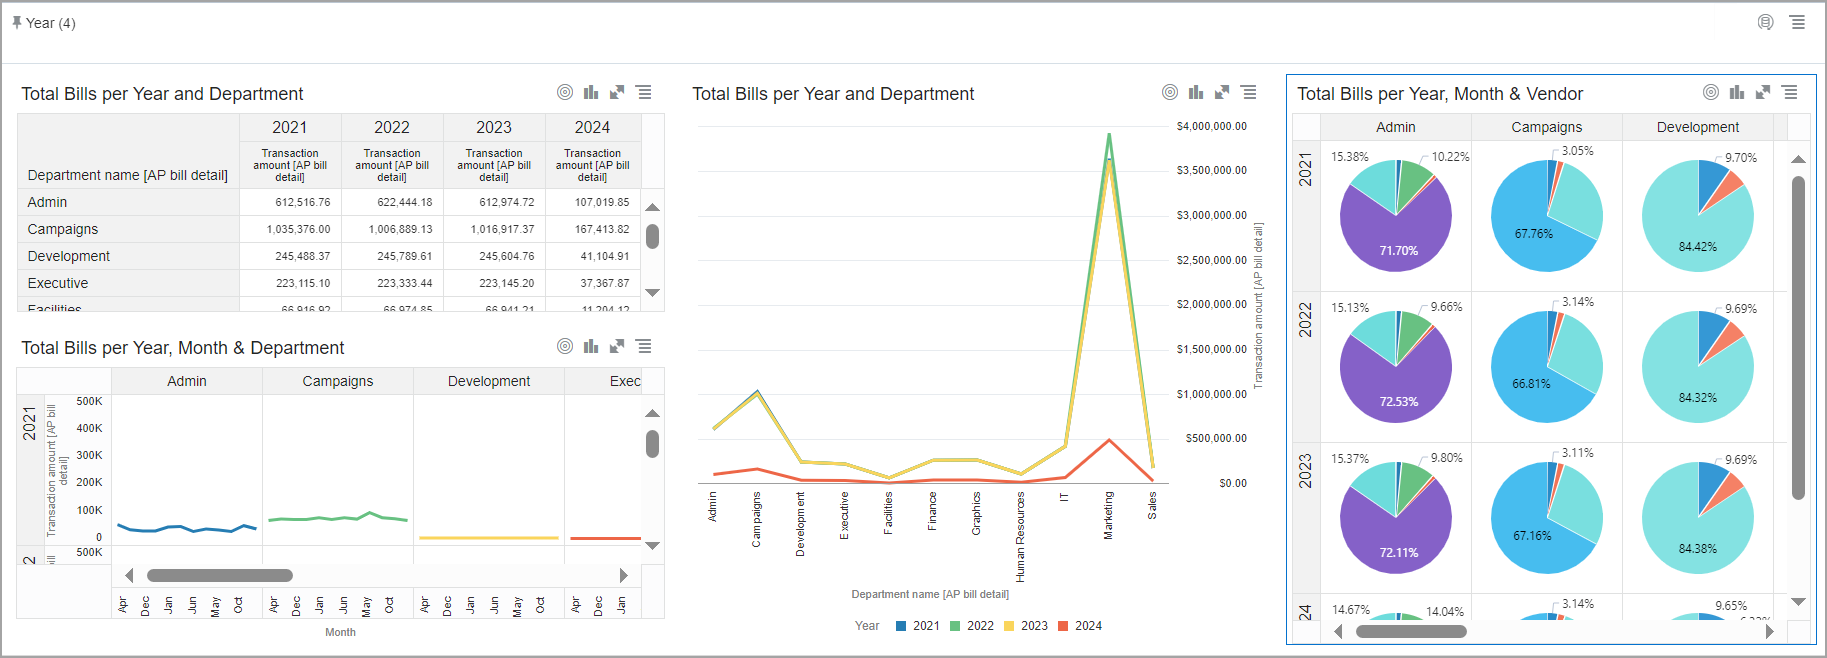
Interactive Visual Explorer (IVE)
For more information, see the IVE learning journey. |
IVE visual board with pivot table, combo, line, and donut chart visualizations. |

| Subscription |
For standard reports: relevant applications (for example, to use standard reports for Inventory Control, you need a subscription to Inventory Control) For financial reports: General Ledger For custom reports: Customization Services or Platform Services For interactive custom reports: Interactive Custom Report Writer For interactive visual reports: Interactive Visual Explorer |
|---|---|
| Regional availability |
All regions |
| User type |
Custom report writer: Business Interactive Custom Report Writer:
Interactive Visual Explorer: Business, Project Manager, Warehouse |
| Permissions |
Custom Report Writer, Interactive Custom Report Writer, Interactive Visual Explorer: Access to the data in the report or visual board |
Next steps
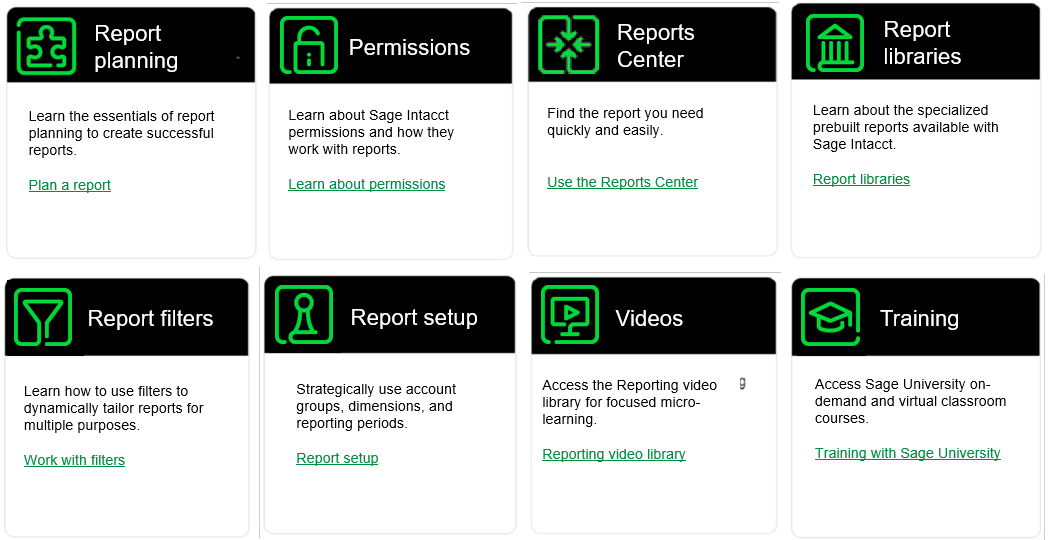
Reports transform data into information that you can analyze and gain insights. Explore the following topics for an in-depth view of the potentials you can realize through the various forms of reporting.
